Predicting College Student Loan Repayment: The Texas Hinson-Hazlewood College Student Loan Program
by SALVADOR HUMBERTO GÓMEZ, B.S., M.Ed.
APPROVED BY SUPERVISORY COMMITTEE:
DISSERTATION
Presented to the Faculty of the Graduate School of
The University of Texas at Austin
in Partial Fulfillment p
of the Requirements
for the Degree of
DOCTOR OF PHILOSOPHY
THE UNIVERSITY OF TEXAS AT AUSTIN
August 1978
Copyright, 1978, by Salvador Humberto Gómez. All rights reserved.
Acknowledgements
Sincere appreciation is expressed to the many individuals who provided educational, technical, and moral support during the course of my doctoral program of studies. It is impossible to name them all; however, some individuals deserve special mention.
To my supervising professor, Dr. Laurence D. Haskew, is an especially large debt for both his intellectual leadership and his unfailing willingness to expand my meager scholarly potential so that 1% would be reflected in my written endeavors. An equally large debt of gratitude is owed to Dr. Dewey Davis for his knowledgeable critiques, helpful suggestions, and faithful positive reinforcement especially when things were not going just right.
Grateful acknowledgment is extended to Mr. John Romanek, without whose technical computer programming assistance this study would not have been possible. Such grateful acknowledgment is further extended to Commissioner Dr. Kenneth H. Ashworth and to Mr. Mack Adams and his staff from the Coordinating Board, Texas College and University System, for their cooperation in providing this writer with access to necessary data from which to conduct
this study.
Finally, my deepest appreciation is reserved for my wife and our five children who have endured this massive undertaking along with me. Our daughter Rosanna, and our four sons, Salvador, Jaime, Orlando, and Ricardo, have remained firm in their desire to have their Daddy succeed and attain a higher measure of dignity and self-respect. My wife Amelia, whose prayers and ability to withstand hardship and stress during these past four years, proved to be the strongest force behind her sometimes-wavering husband.
To these and to the many Financial Aids Officers, students, and others who because of time and space cannot be mentioned here, I thank you with an equal measure of humility and honesty. The sharing of your perceptions,
opinions, and feelings with a stranger has made this investigation possible.
-S. H. G.
The University of Texas at Austin
July 10, 1978
Chapter I: Rationale, Design, and Operationalization of the Investigation
Introduction
Equalization of educational opportunity has been fulsomely treated in literature of the past decade. (For examples, Coleman and Associates, 1966; Crossland, 1971; Harvard Educational Review, 1969.) It has been common to point to education as a partial solution for poverty although problems of poverty are complex and resistant to cure. One who has summed up the relationship between education and equality of opportunity is John Gardner. "Ultimately," he says, "education serves all of our purposes–liberty, justice and all our other ends–but the one it serves most directly is equality of opportunity. We promise such equality and education is the instrument by which we hope to make good the promise" (4:81). The majority of those who are denied an equal opportunity for higher education, for whatever reason, are condemned to a life of second-rate opportunities, menial employment, and too frequently, unemployment–all adding up to substandard lives for both themselves and their children, it is argued.
Furthermore, the more scientific, automated, and computer-oriented our society becomes, the greater the probability that those deprived of equal opportunity for higher education will suffer (5:1). "Yet," says George H. Hanford, "the most stubborn barrier remains. All our efforts to identify and nurture talent in the minority/poverty communities and all our successes in generating aspirations to higher education will have been naught if there are not the dollars to fulfill those aspirations" (6:vi). If education is to occupy a crucial position in making economic and social parity a reality for the economically disadvantaged, then some means has to be found through which the poor can attain postsecondary education. Financial aid to college students was designed with this end in mind, "to permit college attendance by students who cannot afford to pay the expenses by themselves" (7:5.1).
Boyd, in his report concerning the states' involvement in financial programs, concluded that "state comprehensive assistance programs are in a condition of dynamic change . . . a common thread to all developments is that they provide dollars which permit the financially needy student to attend the college of his choice" (8:28).
One such state is Texas; the passage of the Hinson-Hazlewood Student Loan Act of 1965 created the Texas Opportunity Plan. This was and is a state-supported student loan program designed to "make available to the deserving youth of Texas sufficient financial resources to finance the college students' share of the cost of their college education" (9).
The origin and development of governmental programs for loans to postsecondary students are traced inconsiderable detail within Chapter II of the present report. As pointed out there, loan programs are only one variety of governmental programs designed to provide financial aids to penurious would-be students in colleges and universities, in an effort to pursue a social goal of equalizing access to opportunity for education.
Origin of This Investigation
As elaborated upon in Chapter II, public policy to furnish loan programs was predicated on, among other things, an assumption that loans and interest thereon would be repaid by the borrowers. Presumably, this meant taxpayers per se would not be called upon for heavy financial support. As time elapsed however, the repayment patterns of borrowers did not match this assumption. Volumes and incidence of non repayment mounted steadily above those pre estimated. In 1973-1976, the default rates were being highly publicized across the United States. Federal and state government policymakers–as well as institutional loan administrators–were beginning to wonder aloud if the public policy decision had been a mistake. These officials concerned most with the preservation of this policy–legislators, ministerial executive agencies, and institutional loan program administrators–began to search for ways and means to reduce the incidence of non-repayment behavior to levels tolerable for the political system.
The investigator was, and is, one of these concerned, as the Financial Aids Officer for one university in The University of Texas System. He participated in meetings and task force appraisals aimed at reducing the problem of borrower delinquency. As a result, he became (a) rather fully aware of the dimensions of the delinquency problem and suggested means for minimizing it, and (b) much interested in contributing toward the preservation of government student loan programs by investigation of possible "causes" for borrower delinquency.
The Investigation Contemplated
The first task, of course, was to identify a college student loan program to serve as proxy for all governmental loan programs to serve as proxy for all governmental loan programs and the patrons thereof. Naturally, the investigator leaned toward the most convenient one, the Texas Hinson-Hazlewood College Student Loan Program (the successor to the original Texas Opportunity Plan). Comparative examination revealed that its core characteristics were similar to those of other state programs participating in the United States Department of Health, Education, and Welfare’s Guaranteed Student Loan Program. Officials at the coordinating Board, Texas College and University System (the ministerial executive agency for the Texas Hinson-Hazlewood College Student Loan Program [ HHCSLP] were warmly supportive and encouraging toward the utilization of stored data and retrieval facilities. The investigator’s supervising professor also thought the HHCSLP would be a valid proxy, and the first design task was completed by choosing HHCSLP as the referent loan program. A thumbnail sketch of features of HHCSLP follows.
The Texas HHCSLP
The Texas Opportunity Plan, later named the Hinson-Hazlewood College
Student Loan Program (HHCSLP),provides long-term educational loans to Texas residents. To be eligible for a loan, the applicant must be enrolled in or accepted for enrollment in an approved Texas public or private institution of higher education.
The Coordinating Board, Texas College and University System, a state agency, administers the program through a set of Rules and Regulations adopted for this purpose. Each participating college or university is required to appoint an on-campus official who serves as the HHCSLP Officer. This officer, typically the Director of Student Financial Aid, is responsible for the administration of the HHCSLP on campus. Applicants, therefore, secure loans at the Offices of Student Financial Aid in the participating institutions.
To be eligible for an HHCSLP loan, individuals must meet the following requirements:
- Be a legal resident of Texas.
- Be enrolled or accepted for enrollment for at least one-half of a normal academic course load in the participating college or university. If enrolled, the student must be meeting the minimum academic requirements of the institution.
- Establish that he or she does not have sufficient resources to finance a college education.
- Be recommended by two reputable persons in his home community.
- Be recommended by the Texas Opportunity Plan Fund Officer at the participating college or university where the loan application is made. (10)
The amount of a student's loan cannot exceed the difference between the financial resources available to the borrower and the amount necessary to meet reasonable educational expenses as a student. The financial resources considered available to the student include all forms of financial assistance which may be received from any source. A student may borrow a maximum of $1,500 per 9-month school year. Loans of up to $500 are available for students to attend summer school. The total outstanding loan principal due to the State of Texas may not exceed $7,500 at any time.
The 1975 interest rate on loans was 7 percent per annum. Loans are insured by the federal government; if borrowers qualify for the interest subsidy, the government will pay the interest until the student is placed in repayment status. Students are placed in repayment status nine months after they either graduate or leave the institution. Students who do not qualify for the interest—subsidy must pay interest periodically while enrolled and until they are placed in repayment status; at this time it becomes a part of their monthly repayments. To be eligible for the interest subsidy, the student's adjusted family income, as reported on the federal loan application form, may not exceed $15,000 per year. Payments of interest charges for students who qualify for the ¡interest subsidy are made by the federal government directly to the HHCSLP. For an insurance premium, the HHCSLP pays 0.25 percent of the principal for each loan to the federal government agency.
Regardless of the date of loan award, repayment must begin no later than nine (9) months after the borrower is no longer enrolled in an institution of higher education. Payments are made direct to the Coordinating Board in amounts of not less than $30.00 per month. The loan repayment period cannot exceed ten (10) years from the date a borrower last enrolled in a participating institution. All principal is due and payable 15 years from the date of the first note unless special permission is given by the Commissioner of Higher Education to extend the term beyond the 15-year term. Such special permission may be granted for continuing education, military service or financial circumstances. Medical, dental, or other professional candidates seeking an advanced professional degree may secure such special permission, provided proof of acceptance and enrollment in such a degree program is provided to the Commissioner.
To be eligible, an applicant must present letters from two "reputable persons" recommending the applicant for a loan. Information-procuring forms and declarations prepared by the Coordinating Board must be executed; institutional officers may require additional relevant information. These materials attempt to assure that borrowers know they are executing contract(s) for repayment of a loan, and are not receiving a grant. Also, the forms attempt to make clear that the loan is made by the State of Texas, not by the institution. When the applicant is officially accepted for enrollment or enrolled, the Texas Opportunity Plan Officer completes the institution's part of the application forms and submits them to the Coordinating Board for final approval. Upon approval a payment check is sent to the institution, but disbursed to the student only after the student's enrollment status is again verified. When a borrower is eventually placed on payout status, the Coordinating Board prepares the payment cards, mails them to the borrower along with a repayment schedule explaining to him or her how and when to make payments. If a student defaults, the Board is empowered to resort to legal action in order to collect.
The volume and seriousness of borrower default in repayments to HHCSLP are documented by the fact that as of February 1, 1975, Coordinating Board officials had requested the Attorney General of Texas to file legal actions against 7,650 borrowers in repayment status, entailing 9.48 percent of the principal and interest value of all loans extended since inception of the Texas Opportunity Plan and $10,035,793 in money due to the HHCSLP (11). The Texas 9.48 percent of default compares unfavorably with other state student loan programs whose average default rate was 5 to 7 percent in 1973, but more favorably with the national average default rate of 14 percent for the federal government's Guaranteed Student Loan Program reported on January 13, 1973 (11, 13).
The lending capital for the HHCSLP is provided by the sale of General Obligation Bonds of the State of Texas, the authorization of which must be by an amendment to the Constitution of the State of Texas presented by the State Legislature and ratified by a vote of the people. Details of this and other developmental features of the HHCSLP are provided by Chapter II of this report.
The Contextual Framework
The second pre design task was for the investigator to set a context, that is, "a reason why" he was investigating. A few other doctoral dissertation investigations in the student loan default area had been studied. Their context seemed to be that of searching for correlations between descriptors of borrowers and defaults by borrowers. The reports terminated by reporting statistical correlations, or relationships, and somewhat frustrated this investigator by raising, "so what" skepticisms in his mind. He wanted to achieve more than that. He wanted to offer something that might affect public policy, policies of ministerial agencies, and/or institutional administration of student loan programs. All he would have to offer, however, was information and derivations therefrom.
A11 three targets for his desire–public policy, policies of ministerial agencies, and policies/practices, of institutional administration–lay within political systems. In fact, each was a focal processor of input whose output was authoritative governance. "Inputs" gave the clue. One input common to these decision makers was information. If information was deliberately beamed toward solving a problem–such as that of reducing loan default rates–perhaps it could be influential toward outputs, the investigator reasoned. After conferring with members of his supervising committee, he saw that the distinction between his style of study and that referred to above would have to be that of (a) constantly asking, "of what utility (in the practical sense) is the information to decision makers?" and (b) digging much deeper than others have done below the surface of statistical data, using common sense. Those perceptions furnished the essential context descriptor–"findings which are utilitarian for political system decision rendering."
He then went to standard literature on political system decision making and located the Easton Model which, better than those focused upon interperson and intergroup dynamics, seemed to be adequately explanatory of what the investigation would be about. In his Framework for Political Analysis, David Easton offers and explains a “Model for Political Analysis'' (14:7ff). A paradigm representation of this model appears in the following page of this report.
It indicates that the systems within the total environment produce inputs to the political system. Federal, state and/or local governing bodies could be considered the Authorities. An equal educational opportunity could be one of these demands (Inputs), and financial aid could be an Output that is designed to satisfy the environment in response to the demand. Outputs are intended to modify environmental conditions so that the
original circumstances that gave rise to the demands no longer exist, or they may . . . create this impression in the minds of the members, even though in fact nothing other than the image has been changed. (14:127)
The goals of the Authorities are of course to satisfy the environment's demands with positive outputs that will be rewarding to them, i.e., in future elections, and satisfying and beneficial to the environment. The Authorities learn about the consequences of their outputs from information that returns from the environment and eventually flows to them.
. . . there must be a continuous flow of information back to them so that whatever their goals may be with respect to support or the fulfillment of demands, they are aware of the extent to which their prior or current outputs have succeeded in achieving these goals. (14:129)
Easton goes on to say:
With respect to the input of support, we cannot take the goals of the authorities for granted. The authorities need not always be eager to encourage support for a system. . . . However, in some instances the authorities may well be interested in modifying the system radically, or destroying it entirely. (14:129)
Negative feedback, as spawned in the case of excessive interest rates, the declaration of bankruptcy by student borrowers coupled with the existing demands from the environment to place more controls on student loans could conceivably have the "authorities" curtail, modify or repeal student loan legislation.
Thus, the pervading contextual purpose of the present investigation is to introduce information which is useful to Authorities into the Feedback Loop of the model. At present, a previous policy decision (an output) to provide loans to students is arousing consequences which, when information on them is transmitted by the Feedback Loop as inputs, is placing a demand for corrective action upon the Authorities. But information indicating what, if anything, needs correcting is scanty. The investigation contemplated would seek to overcome some of that deficit.
The Investigative Problem
The initial problem stated for the investigation was quite simplistic: "What causes borrower defaults?" This question assumes there are "things" which impact borrowers who default and do not impact so strongly borrowers who repay. However, it was seen, only some "things" may be correctable. In response to the contextual purpose, the question was revised: "What correctable 'things' cause borrowers to default?" Still further difficulty arose. "Things" might be correctable, but the means available to correct them might do more harm than good. For example, a regulation which removes a cadre of borrowers from eligibility might cancel out large numbers of deserving borrowers who will repay. Hence, "constructively" was placed in front of "correctable."
The greatest difficulty with the original statement, however, was the word "causes." Its use would propel the investigator into a never-never land; cause-effect is almost impossible to trace in accounting for human behavior. About the best that can be done is to show cooccurrence between one "thing" and another "thing." For example, taking out a large loan is associated, at greater than random levels, with subsequent default. Obviously, taking out a large loan may be only a symptom of a personhood syndrome or of a set of pressing real-life circumstances which constitute the "cause" of default (if there is actually anything which is the cause of default, which is doubtful). This led to the final operational statement of the investigative problem:
What "things" are significantly associated by co-occurrence with borrower defaults, and which of these are constructively correctable by the authorities?
Analysis of the Problem
Already given was the fact that the HHCSLP and its borrowers would furnish the proxy data to be used by the investigator to test defaulters against "things" for significant cooccurrences.
“Cooccurrences" could not be established as significant without the presence of a population of nondelinquents to compare with a population of delinquents. That necessitated an operational definition of HHCSLP non-delinquents and delinquents in the investigative design. The respective subpopulations would be those borrowers shown as delinquent and nondelinquent on the August 3l, 1976, loan roster.
"Things" to be tested for co-occurrence with being delinquent also had to be operationalized, i.e., defined and selected for the investigative design. This definition is set forth in the next section of this chapter.
"Correctable" had to be interpreted. Determination that a given "thing" can be eliminated or reduced by means available to the Authorities could not be reached empirically, it was assumed. The determination would be by subjective acts-of-mind on the part of the investigator supported by knowledge of real life and deductive logic."Constructively" would likewise be a subjective argument, resting upon empirical evidence gathered by implementation of the investigative design.
"Authorities" also had to be defined operationally. They would be (a) the Texas Legislature, (b) the staff plus Board of the Coordinating Board, and (c) institutional loan administration.
Operationalized Purposes of the Investigator
Obviously, the broad purpose of the investigator was to produce some answers to the problem-question appearing in The Investigative Problem (above).
Analysis of that problem and the contextual framework produced the following operationalized purposes as marching orders for (a) the investigative design, and(b) the dissertation report. These are stated in product format:
- A synthesized portrayal of the origins and nature of the governmental student Loan movement and its resultants in public policy, ministerial policies and consequences, including delinquency in repayments of borrowers.
- Identification of a set of "things" potentially entering into borrower decisions to become delinquent, limited to "things" whose existence can be measured by data procurable from HHCSLP sources.
- Testing the degrees of cooccurrences between these "things," on the one hand, and the prevalence of these things in nondelinquent and delinquent borrowers from HHCSLP, on the other hand.
- A report upon the significance/nonsignificance of cooccurrences with respect to (a) being predictive of non delinquency or delinquency, (b) the extent to which cooccurrences are utilitarian for political system decisioning, and (c) the utilitarian implications of the total array of findings.
- Derivations from the evidence gathered and the experience of the investigator which seem to have consequence for future efforts to reduce repayment delinquency.
The Investigative Design
Sources for Evidence
Three sources were selected to provide some cross-checks upon cooccurrence yields, as well as to produce data more comprehensive with respect to "things" than could be procured from any single source.
Financial Aid Officers in HHCSLP-approved institutions comprised one source. Utilizing a simulation instrument, they forecast the prevalence of 26 "things" in a simulated population of delinquency borrowers compared to an equal-size population of non delinquent borrowers. They were asked to use such hard facts as they had, supplemented by derivations from their observation of borrowers over time.
Borrowers who were, as of August 31, 1976, in repayment status for an HHCSLP loan comprised the second source. A delinquent and a nondelinquent subpopulation established the presence/absence of named "things" as characterizing their in-college and post college experience. Details of the compositioning of the two subpopulations appear in Chapter III of the present report.
The third source was recorded information on borrowers possessed by lending institutions and/or the Coordinating Board. The information was procured for sub-populations of non delinquent and delinquent borrowers.
Details respecting the sampling controls appear in Chapter III.
The "Things" Population
Obviously, it was necessary to have a predetermined set of variables in order to procure comparable data. "Things" was therefore operationally defined as "variant factors, conditions, and/or experiences' ' attached to being a college student and an HHCSLP borrower. It is difficult to draw a firm boundary between these three categories. In the investigator's mind as he searched for putative influences, factors pointed toward semi demographic accompaniments (e.g., family in lowest socioeconomic status; age at date of first loan; borrowed while in a large college). Conditions pointed to circumstantial accompaniments (e.g., number of dependents increased; parents divorced after loan). Experiences pointed to personal encounters, behaviors or conclusions (e.g., assumed loan really would not have to be repaid; disappointed in securing adequate employment). In the texts of Chapters II and IV, the words "factors" or "variables" are used often, in the interest of brevity, to refer to the "things" used as procurers of data.
The task of compiling the list was of major size in the investigative design. As previously noted, the investigator had participated extensively in discussions of the problem of repayment delinquency. He was able to produce a large number of suspect variables which had been pointed to in those discussions. He asked several colleagues, as well as knowledgeable officers in state and national government, to nominate suspects. He consulted every published account of research on the subject he could find (see Chapter II). And he and his supervising professor brainstormed considerably. One of the troubles was that almost every item nominated overlapped other items. The long list of suspects was reduced by combining items, and still further reduced drastically by asking, “Can data establishing the existence of this item be procured within the limits of available time and funds?"
Parenthetically, this latter experience may be as important (though not documented) as any other finding made from the investigation. A very high proportion of a11 suspect variants is non-utilitarian toward strategic or tactical decisions, because data with which to measure their presence/absence cannot be procured within real-life practicalities.
Eventually a final list was arrived at. Its contents may give overemphasis, numerically, to "things" reflecting lack of diligence on the parts of institutional lenders. At the time, lack of loan-officer diligence was a favorite whipping boy. Otherwise, the variables in total were reasonably balanced between the types of "causes" alleged. To conserve space, the list is not presented here. In totality, it appears in the Questionnaires appearing in the Appendix. For the purposes of comparing data-source reports, the total list was telescoped down to 33 variables. These are displayed by Table 11 in Chapter III.
Instrumentation for Data Procurement
For the Financial Aid Officers' source, a novel simulation-based opinionnaire was developed, and it appears in the first pages of the Appendix. Its schematic was to write out an occasion for predicting the proportionate presence of each of a set of suspect variants in a population of delinquent borrowers compared to a population of nondelinquent borrowers. The variables were carefully phrased to communicate to the prospective respondents. The directions to respondents called for coded responses which were quantifiable along a continuum from “decidedly more" (delinquents would show this than would nondelinquents) to "decidedly less." The wording was constantly checked with willing colleagues and the supervising professor for clarity and communicative effectiveness. These checks occasioned successive revisions until a high mark from jury members was received. The instrument, along with a cover letter of request, was mailed to 136 Financial Aids Officers. Information comparing respondents with the recipient population appears in Chapter III.
For the Borrower source, a mail-out questionnaire was also used. The final instrument appears as Questionnaire II in the Appendix. It is much simpler than the Financial Aid Officers' instrument, appearing essentially as a list of experiences for respondents to code as matching or not matching their own experiences. In selecting the items, the investigator was very careful not to include any which would possibly ire delinquent borrowers and thus reduce or bias responses. The instrument itself went through the same revision process described in the preceding paragraph, with some students joining the "¿jury." When finalized, it had such appeal and promise to staff of the Coordinating Board that it was transmitted as a request from that agency for "helpful information." Information on the mailee and the responding populations is given in Chapter III.
The Institutional Records source was tapped by a "Request for Data" form transmitted to each HHCSLP lending institution. A Borrower Population sampling delinquent and nondelinquent subpopulations was drawn by the investigator (details in Chapter III). These names were allocated to the institution of first loan, being entered in random order on the respective request-for-data form. The form provided columns for entering requested data after each student name. Definitions for data requested accompanied the form. The instrument appears just after the Questionnaire III in the Appendix. Information on the solicitee and responding population is provided in Chapter III.
Treatments of Data
Throughout, the treatment of data was constrained by the necessity to compare the incidence and relative prevalence of factors, conditions, and experiences in two subpopulations–non delinquent and delinquent–of borrowers. It was expected that regardless of the source of data, some members of the delinquent subpopulation and the nondelinquent population would be in every distribution cell. The investigator, in treating and in interpreting the data, had to keep forever before him the fact that he was not comparing individuals but whole populations.
The raw data from each individual respondent were to be transferred to a computer input card and thence to tape storage. Computer programs would produce respective subpopulation and "all borrowers" numerical frequency distributions, by code, for each variable; calculate proportionate (percent) distributions of two types: (a) subpopulation members accounting for each of the code frequencies, (b) each subpopulation distribution between code options. This information would be stored and drawn upon by computer programs in calculating degrees of differences between subpopulations in the way their members were arrayed with respect to each variable. Chi-square methodology was to be used to ascertain the statistical degree of difference and to produce the index of difference was not likely to be a function of chance. Thus, it would be discovered which variables, if any, gave statistically significant differences in readouts from the two subpopulations–supporting conclusions that a given variable was or was not predictive with respect to borrower status.
However, the investigator would not forget his utilitarian framework. He would use percent distributions and member-frequencies to further analyze the data which produced "significant" differences of various degree and thus test the utilitarian value of the "predictiveness by cooccurrence" apparently existing. This, in turn, would assist in discovering hunches which might be translated, by logic, into derivations beyond the evidence actually secured.
For final summative purposes, the investigator would employ a four-cell classification for the predictive potency of variables: Not Predictive; Mildly Predictive; Considerably Predictive; Strongly Predictive. This device, with its definitions and applications, is described more fully in Chapter IV.
The investigative design described was implemented. This dissertation report includes the results produced from the design.
Arrangement of the Report
Chapter II is a documentation for the background from which this investigation emerged. As indicated, it portrays the genesis and development of the student loan movement and the public policies it spawned.
Chapter III is the traditional "research" chapter. It treats separately each of the three sets of data obtained, respectively, from Financial Aid Officers, Borrowers, and Records. The findings from each are presented and interpreted. Summation of the three sets of findings,however, is pushed forward to Chapter IV.
Chapter IV may be described as the investigator's chapter, in which he puts himself into the findings and tries to extract significance and derivations of considerable import.
References
- Coleman, James S., et al. Equality of Educational Opportunity. Washington, D.C.: U.S. Office of Education, 1966.
- Crossland, Fred E. Minority Access to College: A Ford Foundation Report. New York: Schacken Books, 1971.
- "Equal Educational Opportunity," Harvard Educational Review 39, no. 2 (1969).
- Goals for Americans: The Report of the President's Commission on National Goals. Englewood Cliffs, N.J.: Prentice-Hall, Inc., 1967.
- Wright, Stephen J. The Financing of Equal Opportunity in Higher Education: The Problems and the Urgency in Financing Equal Opportunity in Higher Education. New York: College Entrance Examination Board, 1970.
- Hanford, George H. Financing Equal Opportunity in Higher Education. New York: College Entrance Examination Board, 1970.
- Manual for Financial Aid Officers, Part Five: "Need Analysis.'" New York: College Entrance Examination Board, 1971.
- Boyd, Joseph D. "20 States Aid Students,” College Management 5, no. 3 (1970): 21-30.
- Section 506, Article III of the State Constitution and Chapter 101, Acts of the 59th Legislature, 19659 (compiled as Article 26549, Vernon's Annotated Texas Statutes). Austin: The State of Texas, 1975.
- Coordinating Board, Texas College and University System. Rules and Regulations of the Hinson-Hazlewood College Student Loan Act. Article III, Section 1, Austin, Texas, 1971.
- Adams, Mack. Head, Student Services Division, Coordinating Board, Texas College and University System. Interview, February 27, 1975.
- Winkler, Karen J. "Defaults Up," The Chronicle of Higher Education, September 30, 1974, p. 7.
- Bell, Dr. Terrell. U.S. Commissioner of Education, as quoted in "Student Loan Millions Asked," The San Antonio Express, February 24, 1975, p. 2A.
- Easton, David. A Framework for Political Analysis. Englewood Cliffs, N.J.: Prentice-Hall, Inc., 1965, p. 110.
Chapter II: Background of the Investigation
Section One: Evolution of Financial Aid to College Students
Financial aid to students has a history almost as old as that of higher education in America. Early programs of student aid in American colleges were started with money provided specifically by private individuals and groups to aid needy and worthy students. The original purpose of student aid was to make a college education available to any otherwise qualified individual who could not himself pay for the cost of attending college. Rudolph comments that
the college was not to be an institution of narrow privilege. Society required the use of all its best talents, and while it would, of course, always be easier for a rich boy than a poor boy to goto college, persistence and ambition and talent were not to be denied. The American college, therefore, was an expression of Christian charity, both in the assistance it gave to needy young men and in the assistance it received from affluent old men. (1)
Programs of financial assistance for students in America can be said to have begun in 1643 when Lady Anne Mowlson gave one hundred pounds to Harvard during its early days and set up the first student assistance endowment fund in an American college. "With this somewhat unfortunate and illfated beginning, American colleges began the practice of financing students" (2).
Between 1643 and until about the time of the Civil War, student financial aid underwent its first era of trying to identify itself in the social setting. American colleges had inherited many of the aristocratic goals, purposes, and customs of the English residential colleges. That, it was soon discovered, did not fit into the developing democratic society of the America of that day. As the American college slowly evolved into a democratically oriented institution, it began to receive increased amounts of both private and governmental support, with some of the support taking the form of recognizable, overt student aid (2:2).
Democratic idealism gave colleges and universities a much broader social purpose than institutions of higher education had previously known. With time, this social purpose developed into a national purpose. More
and more poor young people began attending college in quest of an education as a means of changing their economic conditions. This trend alarmed some of the more "aristocratic” citizens. A South Carolina editorialist stated, "if the state sets up a college, learning would become cheap and too common, and every man would be for giving his son an education” (1:20).
However, as early as the latter part of the eighteenth century, the Harvard College chapter of Phi Betta Kappa established a fund for the aid of indigent members (2:5). Later at Brown University, a society was organized for the purpose of lending textbooks to poor students. In some colleges, special dining halls were set up to help needy students.
Another form of student financial aid to emerge during the early days was that of manual labor. "The notion that young men could earn enough money to pay their way through college gained rapid support" (2:3). This notion appears to be the foundation of what much later became cooperative education and college-work-study programs.
Immediately following the Civil War, the "popular" colleges emerged. They were established for the purpose of meeting the expanding need for technical and scientific education which had been produced by the Civil War. One of these was the Massachusetts Institute of Technology (2:6). The Morrill Act of 1862 put federal largess at the disposal of every state government. Funds derived from this legislation were designed to develop in the land-grant colleges after the Civil War a "new network of institutions” with a popular or practical orientation (2:7). And, by making the colleges popular and more desirable, it placed a new burden on the tradition of student aid and argued forcefully for the maintenance of equality of access to higher education.
The first significant example of state-funded student financial aid after the Civil War came with the state legislatures providing free tuition to Civil War veterans at state colleges and universities (2:7). AT about this same time, private institutions began to receive their first endowments for purposes of student financial aid from America's first "corp of millionaires" (2:7). Harvard President Charles W. Eliot, in his inaugural address at Harvard in 1869, remarked that "no good student need ever to stay away from Cambridge or leave college simply because he is poor . . . the recipient must be of promising ability and the best character . . . the community does not owe superior education to all children, but only to the elite . . . to those who, having the capacity, prove by hard work that they have also the perseverance and endurance" (3).
Later, the category of loan funds was added. This became a particularly attractive form of student aid to a generation that was '"wedded not only to the myth of the self-made man but to some equally pervasive myth that came under the label of social Darwinism" (2:8). The belief of that day was that loans did not damage individual character as much as did scholarships and other direct forms of student aid. Governor Lucius Robinson of New York remarked in 1877 that, "loans taught obligation, while scholarships and other forms of free higher education might fill the masses with discontent, unsettle their purposes, and destroy their initiative" (4).
In the twentieth century, the American tradition of student aid for higher education climaxed with an ever increasing effort to make higher education available to all who would seek it. Rudolph explains it this way:
The federal government in this century has used student aid to fight a depression, to thank the veterans of two wars, and to shore up the national defense. Some state governments are transplanting student aid into networks of colleges; municipal institutions dispense with tuition charges; local committees, high schools, and service clubs distribute aid funds of their own. Alumni groups, foundations, and business concerns multiply their exertions in behalf of the American college student. (2:1)
Federal Government Activities
The idea of the federal government's providing direct financial aid to students is relatively new. During the days of the Great Depression of the 1930s numbers of students were aided through such agencies as the National Youth Administration, but programs of this nature were short lived.
During World War II, the federal government made some eleven thousand loans to students in selected fields of study in an attempt to maintain interest and enrollment in curricula of vital need to the national security (5).
In the closing months of World War II, the Servicemen's Readjustment Act of 1944, better known as the G. I. Bill, was passed. This action, taken by a grateful citizenry, allowed a large number of students to attend college with a very substantial direct support from the federal government granted without regard to financial need (6). Since the passage of the first G. I. Bill,
Similar legislation has been enacted for veterans of the Korean conflict as well as the Vietnam War.
Other federal legislation in 1958, as an outgrowth of Sputnik, and in 1965, as an outgrowth of the Civil Rights movement, involved the federal government still more in the role of providing financial aid to students (7).
A series of federal enactments designed to aid needy students in higher education began with the National Defense Education Act of 1958. Title II of this act created the National Defense Student Loan Program. The initiation of this program marked the beginning of a new era in massive federal aid to students in institutions of higher education, and indirectly to higher education itself.
Funds from this program were intended to aid students seeking baccalaureate degrees in engineering, mathematics, modern foreign languages and education. The pattern of selecting loan recipients was similar to that for scholarships. However, as time passed, affording preferential treatment to academically superior applicants was no longer mandated by the Act. This represented an important shift in the rationale behind most college financial aid programs, and particularly those programs funded in part by the federal government. Financial need became the primary criterion for eligibility.
Since its enactment, the National Defense Education Loan Program has been the backbone of all federal government programs for student aid. It has grown from an initial $6,000,000 appropriation in 1959, to a $293 million appropriation for the 1974 fiscal year (8) (9).
The passage by Congress of the Higher Education Act of 1965 added some new dimensions to the trends in student aid programs in higher education. It created a program of grants for undergraduates, and a student employment program. In addition to continuing the National Defense Student Loan program, it created also a federal government program to guarantee the repayment of loans by students as well as to pay interest subsidies to lenders on loans made by private or public agencies. This became the Guaranteed Student Loan Program, and was also the earliest legislation that "accepted as a national purpose the opening of opportunity for postsecondary education to all qualified students" (7).
This legislation prompted many private lenders to involve themselves in the business of providing financial aid to students. Some saw it as a long-term investment in future business, others did it as a means of supporting sons or daughters of "long-time"” customers.
States also began creating their own student loan programs in the middle and late 1960s. These state loan programs multiplied and by 1974 there were 24 state supported loan programs in existence (10). Some of these programs were insured by the federal government's GSLP, some were not.
The State of Texas created its student loan program, the Texas Opportunity Plan (later named the Hinson Hazlewood College Student Loan Program), in 1965 (12).
Section Two: History of the Hinson-Hazlewood College Student Loan Program
The Texas Hinson-Hazlewood College Student Loan Program was fashioned after the Opportunity Plan, Incorporated (OPI), originally initiated at West Texas State University at Canyon, Texas. The OPI was designed, organized and eventually implemented from 1961 to 1970 by Milton Morris, the Director of Student Assistance at West Texas State University. The OPI was created from private contributions. It was designed to provide loans to students attending that university (11).
Mr. Morris stated that he, like Governor Lucius Robinson, believed that loans were better than grants as a means of molding character through responsibility whenever possible. While he wanted to provide students with financial assistance, he also wanted to teach the students to manage their personal finances as they received their education.
Students receiving loans under the West Texas State University OPI were required to submit a budget estimating their expenses prior to the beginning of every semester. Once the budget was approved, the loan was set aside for the borrower in the amount necessary to cover the expected expenses. The student would accept the check for the loan, and then deposit the money, in his name, at the OPI Program Office. The student was asked to keep a record of his expenses; these records were checked three times during the semester. As student borrowers and/or depositors needed money for the expenses outlined in their budgets, they would draw against their OPI accounts. The purpose of turning the money over to OPI was to keep the students from spending their money on items other than budgeted ones, or from exhausting their resources before the end of the semester (11).
Upon graduation or leaving the institution, students executed a promissory note and agreed to a monthly installment repayment schedule. The money borrowed carried no interest and students were given a grace period of several weeks after leaving college before their first payment became due. This allowed students time to secure a job and get somewhat settled before their monthly installments began.
Mr. Morris conceived an idea of creating a statewide student loan program, and discussed it with the state senator from his district, Senator Grady Hazlewood. Senator Hazlewood arranged for Mr. Morris to meet with Governor John Connally at Austin. Mr. Morris suggested to the Governor the necessity for such a state loan program. Governor John Connally, in his opening message to the 59th Legislature, proposed establishment of a statewide college student loan program (12). Representative George Hinson of Mineola authored and sponsored the necessary legislation in the House of Representatives. Senator Grady Hazlewood of Amarillo authored and sponsored corresponding legislation in the Senate (12).
The joint resolution sponsored by Representative Hinson and Senator Hazlewood proposed an amendment to Article III of the Constitution of the State of Texas creating the Texas Opportunity Plan Fund. This was passed by the Legislature and the proposed Constitutional Amendment was submitted to the voters of Texas on November 2, 1965. It provided for the sale of general obligation bonds of the State of Texas not to exceed $85,000,000 (12). The amendment was publicly endorsed by the Coordinating Board, Texas College and University System. It was passed by the voters. The Coordinating Board was charged with full administrative responsibility for the Texas Opportunity Plan, and work was begun immediately to implement this new responsibility (12).
An Advisory Committee on Student Loan Procedure was appointed by the Coordinating Board on November 15, 1965; the Coordinating Board also set September, 1966, as the date on which the first loan was to be made. The First Southwest Company of Dallas was selected to serve as financial advisor in February, 1966. The law firm of McCall, Parkhurst and Horton was selected to serve as the state's legal counsel in regard to insurance and sale of
the bonds (12:8).
On July 18, 1966, $10,000,000 in bonds were sold at an interest rate of 3.77392 percent to Harris Trust and Savings Bank of Chicago (12:8). The Texas Opportunity Plan (later renamed the Hinson-Hazlewood College Student
Loan Program) was therefore established and funded. Having worked out financial details, the Coordinating Board instructed its staff to design a set of lending and collecting procedures, and the necessary forms to be used in administering the program. Subsequently, workshops were conducted throughout the state to explain the loan program to Financial Aids Officers at the institutions of higher education which had requested participation in the program (12:8).
The original rules and regulations for the program required that an applicant:
- be a resident of Texas.
- complete an application for a loan on the forms provided by the Commissioner.
- be enrolled in a college for at least half time.
- establish that he or she had insufficient resources to finance his/her college education.
- be recommended for a loan by the financial aid officer at the institution where the student is enrolled or accepted for enrollment. (13:10)
In addition to the above, the rules set a loan ceiling of $5,000 for undergraduate students and an additional $2,500 for graduate students. The total loan to any individual student in any academic year was not to exceed $1,500 to a graduate or professional student or $1,000 to an undergraduate student (13:12).
Five years was set as the maximum length of time a borrower was to be allowed to retire the loan (13:14). Borrowers were to be placed in repayment status four months after they either left the institution or ceased to be enrolled on at least a half-time status (13:15).Fifteen dollars per month was set as the minimum monthly payment, with payments varying in direct proportion to the size of the loan and the five-year repayment period (13:15). For each $1,000 borrowed, $1.44 per year was to be charged for life insurance that would guarantee the repayment of the loan in case of the borrower's death or permanent disability (13:19).
In September, 1966, the Coordinating Board was approved by the U.S. Office of Education as a lender under Title VI-B of the Higher Education Act of 1965. With this approval, Texas Opportunity Plan loans became subject to federal government interest subsidy. The federal government agreed to pay the full 6 percent interest (as set by the Coordinating Board) charged on loans to a qualified student so long as the student continued to be enrolled on at least a half-time basis. Once the student entered into repayment status, the federal government was to pay one-half the interest charges (12:10). Interim notes were to be executed by the borrower upon receipt of each loan. The originals of these interim notes were to be kept at the institution with copies going to the Coordinating Board. Pay-Out Notes were to be completed at the time a student no longer intended to borrow from the program.These Pay-Out Notes covered the total of all loans, interest, and insurance cost. The original copy of the Payout Note, along with all original copies of Interim notes, were then to be sent to the Coordinating Board. Before preparing a Pay-Out Note, the institution would request from the Coordinating Board a summation of all loans entered into by the student. The Coordinating Board would then provide the institution with the total amount that was to be used on the Pay-Out Note (13:14).
An Exit Interview Form, containing the student's name and address, the names and addresses of his parents and two close relatives, employer name and address, and plans for the next two years was to be completed by the student upon completion of the Pay-Out Note. In signing the Exit Interview Form, the borrower would certify that he was aware of his repayment responsibilities to the loan program and of his indebtedness to the State of Texas.Since payments were to be made directly to the Coordinating Board in Austin, the college (except for minimal collection effort) was to have nothing to do with the collection of loans (13:15).
The Coordinating Board's 1971 policy on enforcement of collection effort stated that:
When any person who has received a loan authorized by the Act shall have failed or refused to make as many as six monthly payments due in accordance with an executed note, then the full amount of the remaining principal and interest shall become due and payable immediately, and the amount due, the person's main last home address, and such other information as may be requested by the commissioner shall be reported by the participating institution to the Commissioner who shall report such person to the Attorney General. Suit for such remaining sum shall be instituted by the Attorney General or any county or district attorney acting for him in the county of the person's residence, the county in which is located the institution at which the person was last enrolled, or in Travis County, unless the Attorney General shall find reasonable justification for delaying suit and shall so advise the Commissioner in writing. (14:18)
On August 31, 1966, the first Texas Opportunity Plan loan was extended to Miss Donna Zenor, a freshman student at West Texas State University at Canyon, Texas. The student was a resident of Canadian, Texas (12:8).
Between 1966 and 1976 many changes in the Texas program have taken place. Some of the major changes were:
- Increases in Interest Rates for Loans. The loan interest was originally set at 6 percent simple interest per annum (12:10). It was to be paid to the state by the federal government while the borrower was in school and up to the time he was placed in repayment status. When the borrower began repaying his loan, he was to pay 3 percent interest and the federal government the remainder. Effective September 1, 1969, the interest was increased to 7 percent; the sharing was also changed. The federal government ceased to share in the payment of the interest once the borrower went into repayment status; it did, however, continue to pay the entire interest while the borrower remained enrolled on at least a one-half time basis up to the time he converted to repayment status (14:14). The interest rate in 1976 was still 7 percent.
- Increase in Bonds Outstanding. Legislation providing for the sale of general obligation bonds of the State of Texas not to exceed $85,000,000, at an interest rate not exceeding 4 percent, was approved by the voters of Texas in 1965. Under this authorization, $10,000,000 in bonds were sold in July, 1966; an additional $39,000,000 of this original authorization was sold by August 31, 1969. However, because of the low interest rate set, the remaining $46,000,000 of authorized bonds could not be sold in the existing market (15).
On August 5, 1969, the voters of Texas approved a constitutional amendment authorizing the sale of an additional $200,000,000 of State of Texas College Loan Bonds. These additional bonds were expected to be sufficient to meet loan demands beyond the capacity of the original authorization then being used. The 1969 bond authorization did set interest rate limitations and issues of these bonds were expected to be sold in combination with some of the originally authorized bonds so that sufficient loan funds would be available for students through the 1975-76 academic year (15).
By August 31, 1970, an additional $1,800,000 of the original $85,000,000 bond issue had been sold; this brought the total bonds sold from the original issue to $40,800,000. Of the 1969 $200 million authorization, $42,200,000 had been sold. This brought the total bonds sold to $83,000,000 (16).
In Fiscal Year 1971, from the 1969 authorization $30,515,000 in bonds were sold. This brought the total bonds sold from this authorization to $72,715,000, and total bonds sold from both authorizations to $113,515,000 (17). Some of the principal of the bonds had been retired during the year leaving a net bond indebtedness of $112.5 million.
To meet the needs of student borrowers, $20 million of State of Texas College Student Loan bonds were sold in 1972 at an average interest rate of 4.89 percent. As of August 31, 1972, the Coordinating Board had sold a total of 135.5 million in loan bonds and had retired $5.5 million of the principal, leaving net bonds payable of $130 million (18).
Subsequent bond sales of $10 million in July of 1973 (19), $15 million in July of 1974 (20), and $13 million in May of 1975 (21) brought the total bonds sold to $175.5 million. However, $15,120,000 of the principal had been retired, leaving net bonds payable balance of $156,380,000 as of August 31, 1975 (21).
- Increases in the Number of Students Served Annually. The increases in the number of students served by the program annually are tabulated following:
During the 1974-75 academic year, 23,197 students borrowed $21,115,242 (32). This number of students and amount of dollars represented: (1) 42,248 (65 percent) fewer student borrowers than in the 1969-70 academic year; (2) only $2,868,530 (10 percent) less dollars loaned than in four years prior to the 1974-75 year.
At the end of the first four years of the Program's operation, the average amount being borrowed by students during their college careers was averaging $1,045 per student (16:102). During the 1974-75 academic year, this amount had increased to $1,414 per student, constituting a 29 percent increase. The average annual loan per student also increased from $367 during the 1969-70 academic year (16:102), to $462 in the 1974-75 academic year (32), an increase of 20 percent. Thus, $8.5 million was required in 1974-75 just to fund the increase in the average size of loan to students. Increases in loan sizes appear to have paralleled rather closely the increases in required costs for attending college between 1969 and 1975 (16:102, 32:173).
- Changes in the Term of the Loan, Grace Period, and Monthly Payments. The period of time a borrower was given to pay out his loan was originally set at five years (13:14). Effective July 15, 1971, this period was increased to ten years, with a maximum limit of 150 years from the date of loan execution (17). The latter extension in time span was designed to allow students on pay-out status but in the Armed Forces or in hardship to postpone their monthly payments for a maximum of three years. Also, the grace period borrowers were given from the time they ceased being enrolled, and the time they entered into repayment status was extended from four to nine months (17). This allowed student borrowers graduating or leaving the institution more time to secure employment and arrange their finances before starting to pay back their loans, and also gave the Coordinating Board more time to prepare the documents necessary to place the student in pay-out status.
Minimum monthly payments were originally set at $15 per month (13:15). For the Fall Semester of 1971, the Coordinating Board increased the minimum monthly payment to $30 per month (13:9).
- Increase in the Maximum Dollar Amount Students Might Borrow. The original limit placed upon the amount one student could borrow was $100, with $1,500 set as the maximum loan in any one year for graduate and 53 professional students and $1,000 for undergraduates (13).On July 15, the maximum total for one student was raised to $7,500, and $1,500 set as the maximum amount a graduate, professional, or undergraduate student could borrow during any one academic year (14:10).
- Change in Program Name. Through a joint resolution, the 6lst Legislature (1969) changed the name of the Texas Opportunity Plan Loan Program to the Hinson-Hazlewood College Student Loan Program. The name was changed, the resolution stated, in order to honor the men who sponsored the original bill in the House and the Senate.
- Change in Lending Procedures. The most drastic change, in terms of procedure, came in January of 13970 when the Coordinating Board adopted two amendments to its Rules and Regulations governing the Hinson-Hazlewood Program. Effective August, 1970, an institution having 10 percent of its borrowers six or more payments behind in payments due would be suspended from making loans; an institution would be placed on probation if its delinquency rate reached 5 percent. Also, all notes by students would require a cosigner except in the case of extreme hardship (16). These two regulations came at a time when the delinquency rate of the program stood at 35.95 percent as of December 31, 1969, and were intended to bring this delinquency rate down (15).
Under the new regulations, cosigners were not only required on all notes but also,
Individual institutions of higher education participating in the program will have more responsibility for administering the program, including
loan collection as well as making the loan. . . .(16)
This charge to institutions apparently had the effect desired. It was followed by a significant increase in loan repayments and a decrease in delinquency rates. By the end of the first fiscal year after the effective date of the new rules, the number of institutions under suspension from participation in the program had dropped from 50 to 14. The rate of accounts six or more months in arrears had dropped to 6.28 percent as compared to 10.08 percent as of November 30, 1969 (16). With the advent of Federal Insurance in September of 19/71, the requirement for cosigners was dropped (23).
- Fluctuation of Delinquency Rates. The proportion of all borrowers with repayments past due for one to five months is usually considered as predictive of borrowers’ subsequent payment patterns. Following are the percentages of delinquency in the one-to-five-months' category at the end of each fiscal year, 1970 through 1975:
Change
Fiscal Years Ending Percent Between Years
August 31, 1970........19.35 (16:102)
August 31, 1971........21.06 (+1.71) (33:86) |
August 31, 1972........16.75 (-4.31) (33:185)
August 31, 1973........11.91 (-4.84) (34:190)
August 31, 1974........10.99 (-0.92) (35:168)
August 31, 1975........15.48 (+4.47) (32:174)
Average of six years...15.92
Of concern to many was the fact that the delinquency rate for 1975 increased by 4.47 percentage points over 1974.
- Conversion to Federally Insured Loans. Another significant development that took effect in the program was conversion to the Federally Guaranteed Student Loan Program. The Coordinating Board had recommended that "appropriate legislative action be taken to permit the program to qualify as an ‘eligible lender’ under the Federal Loan Insurance Program (Title VI-B of the Higher Education Act of 1965, as amended)" under which the federal government would guarantee to the State of Texas the repayment of unpaid loans (16). Staff members began discussing necessary procedures with U.S. Office of Education officials, and steps were launched to obtain the statutory changes necessary to qualify for participation in the Federal Guaranteed Loan Program. These statutory changes were made by the 62nd Texas Legislature session.
Arrangements were then completed for the Hinson-Hazlewood College Student Loan Program to participate as a guaranteed lender in the Federally Insured Student Loan Program. Approval was secured in July, 1971 and federal loan insurance was obtained on all loans made by the Hinson-Hazlewood College Student Loan Program for and after September 1, 1971. The primary effect of the new contractual arrangements was that, through the U.S. Commissioner of Education, the federal government would repay the State of Texas the amount of the student loans outstanding which were delinquent longer than four months. The federal government would then assume responsibility for the collection of those delinquent accounts (17). Also guaranteed were the notes of borrowers who died or became permanently and totally disabled (18).
For a default claim to be paid, federal government regulations require that lenders must prove that due diligence has been exercised in attempts to collect from delinquent borrowers. "Due diligence" is considered to include a telephone contact with the borrower within ten days of the date a payment is missed, followed by frequent written contacts throughout the 120-day period that must have lapsed before the claim is filed. This requirement caused considerable reorganization and supplementation in the previous collection activities of the Coordinating Board's staff (18).
Loans made prior to 1971 (which were not insured by the federal government) were being collected in 1975 through procedures the same as those used for insured loans, except that the Attorney General of Texas was requested by the Coordinating Board to file suit against borrowers when they became six payments past due. To expedite the filing of suits through the Attorney General's Office, the Coordinating Board staff was doing all of the clerical work necessary for suit filing. Court costs and citation fees were paid from Hinson-Hazlewood Program funds (21).
On April 30, 1976, despite rigorous collection procedures and efforts on the part of the Coordinating Board staff, 12,370 (15.25 percent) of the accounts in repayment status were one to five payments past due;10,307 (9.88 percent) of the accounts in repayment status had been referred to the Attorney General for collection; and, 4,604 (3.92 percent) other accounts had been sent to the Attorney General for collection assistance. Combined, 27,331 (29.05 percent) of the accounts were delinquent.
Mr. Mack Adams, Head of the Student Services Division of the Coordinating Board stated to the investigator, “obviously something has to be done to curb the current delinquency rate. What steps will be taken to carry this about remains to be seen” (24).
Section Three: Review of the Literature
A review of the current literature about the Hinson-Hazlewood College Student Loan Program reveals that only one doctoral study has been reported, by Baker Pattillo in 1971. Purpose of that study was to determine if the items of information being requested on the Hinson-Hazlewood Loan Application could be used to identify prospective delinquent borrowers. Findings were that of the 45 application variables compared with delinquency/non-delinquency status, only seven were significantly related at the .05 level of confidence. These seven variables were: the student's summer estimated income; loans of any kind incurred previously; total annual family income; previous receipt of a TOP loan; number of dependents; year of birth; and, possession of life insurance (36:99). Pattillo commented that because of the high delinquency rate and inadequate staff in the Coordinating Board, the Hinson-Hazlewood College Student Loan Program, "is likely to be short lived" (36:44).
Other literature relevant to the present investigation reports the opinions and pronouncements of authorities in student personnel matters and/or results of studies conducted. Extractions from that literature are now presented under eight rubrics.
Financial Counseling
The focal point for most financial aid programs is the student. Consequently, student contact is a major element in the routine of most financial aid offices. This contact may vary in quality and length, but it is always present and necessary. Wrenn states that
the type of aid given to a student varies with, the student's background of experience and present level of development. The application of this principle calls for a careful appraisal of a financial need that is one of a congeries of basic needs–social, emotional, health, vocational and financial. It becomes a counseling problem rather than merely a matter of apportioning available money. (25:381)
Risty points out the crucial role of financial counseling for the student:
. . . the concept for financial counseling is generally a recognition of individual differences in assisting a student in orienting himself to the problem of financing his education, particularly in the direction of independence and high order of personal responsibility . . . .(26:223)
Gross indicates that financial counseling can be considered as counseling only when a cooperative approach to decision making is used and the counselor is sensitive to the meaning of the problem being presented, is capable of transmitting financial aid information, and has taken into account the financial resources available to the student (27).
Considerable assumption appears in literature that the counseling function has qualitative influence upon the repayment behavior of student borrowers. For example, if financial aid counseling is to be effective, it is said the financial aid offices should insure that: "Staff members who have the responsibility for student contact are sensitive to and skilled in interpersonal relations; are knowledgeable of the financial aid programs within the office and the institution; and maintain strict confidentiality of all student information" (28).
Sex, Grade Point Average and Socioeconomic Status of Borrowers
A study concerned with student loan delinquencies was conducted by Dan B. Wolf in a large Midwestern University. The study was designed to determine the extent to which a predictive profile could be constructed from characteristics of students having delinquent loan accounts. Wolf hoped that such a profile would help in reducing future loan risks (29).
The study addressed itself to “those loans due on or before December 21, 1960, but still unpaid as of June 30, 1961." Included in the population studied were c61l loans awarded to 202 students. The original value of the loans was $32,779 and of that amount only $5,645 (17 percent) had been repaid by due dates. Men and women had each repaid only 17 percent of their loans as of the date their loans were due; hence, no differences between sexes in the repayment of loans appeared to exist.
Another part of Wolf's study compared delinquency with grade point average. Using the University's grading system (three points for an "A," two points for a "B," one point for a "C," no points for a "D," and a minus one point for an "F") the study revealed that 7 percent of the delinquent loans had been extended to students with a grade point average between -l and O (F to D) at the time the loan was awarded. Twenty-six percent were extended to students with a grade point average between O and 1 (D to C) at loan granting time. Fifty percent were extended to students with a grade point average between l and 2 (C and B) at loan granting time. Only 1’? percent of the delinquent loans were to students maintaining a grade point average between 2 and 3 (B to A) at loan granting time. (29:123)
In total, 67 percent of the delinquent borrowers (50 percent in the C-to-B, and 17 percent in the B-to-A categories) were maintaining "good standing" grade point averages at the time the loans were extended. Hence, it was concluded that low GPAs were not explanatory of repayment delinquency.
Wolf was unable to obtain enough data from the students' personal records related to socioeconomic factors to include such factors in his study. However, Wrenn had concluded ten years earlier from an investigation that "the relationship between college ability and economic level is not as consistent as is commonly believed" (25:352). His facts indicated that an economically disadvantaged student is no more often a bad loan risk than one not so classified.
Delinquency and Part-time Work
Charles Harrington conducted a study of an emergency student loan program at Ohio University in 1963-64. Its purpose was to isolate characteristics which distinguish students who tend to become delinquent. A sample of nondelinquent borrowers was matched with a sample of those with delinquent accounts. The student record files of the two sample populations were analyzed to locate background factors that were characteristic of each group and which might, therefore, afford a basis for predicting future repayment practices (30).
Harrington found:
- No relationship between variables of sex, or grade point averages, and repayment behavior.
- Positive relationships between non delinquent payees and (1) active participation in high school extracurricular activities carried over into college, and (2) working while attending college.
- Positive relationship between non-delinquency and working at least part-time while attending college.
- Positive relationship between delinquency and failure to receive financial counseling at time of taking out a loan. (30:234)
A study by Bergen and others (37) in 1970-71 concerning Grade Point Average (GPA) and delinquency in the repayment of National Defense Student Loan (NDSL) secured results that conflict with the findings derived by Harrington. The Bergen study was conducted at Kansas state University and used as a sample 1,574 NDSL recipients who had terminated their education at that school prior to September, 1966, and who had established repayment patterns over at least 18 months. GPA classifications were defined as high (3.0 to 4.0), medium (2.2 to 2,9), and minimal (below 2.2). The size of the loan was classified as modest (under $1,500), medium ($1,500 to $2,999), or large ($3,000 or larger). Extent of delinquency was measured by the number of months payments were shown as delinquent on the borrowers’ records.
Findings indicated that borrowers with modest loans had less delinquency than borrowers with medium loans; and that borrowers with medium loans had less delinquency than borrowers with large loans. This was at the level of delinquency of one or more months past due. The size of loan seemed to be positively associated with percentage of delinquency–the higher the loan, the higher the percentage of delinquency.
Borrowers with minimal GPA had a higher repayment record than borrowers with high or medium GPA, in that order, but no significant difference existed between high and medium GPA in association with percentage of delinquency.
Another set of comparisons was run, using a proportion of prepaid loans (i.e., borrower was ahead of schedule) as the dependent variable, with size-of-loan; null hypothesis was rejected. The smaller the Loan, the higher was the proportion of prepayments. With respect to GPA, the highest proportion of prepayments occurred for those with minimal GPA; no difference existed between medium and high GPA subsamples.
Bergen concluded:
Loan officers and committees, if they are concerned primarily with loan repayment, might be justified in using grades as a factor in granting loans... However, the amount which the student borrows during his college career is not a significant factor in predicting repayment habit. (37:67)
It must be noted that this conclusion appears to conflict with Bergen's findings.
Graduation, Academic Achievement and Delinquency
In 1967, George and Patricia Nash conducted a study to discover conditions and factors influencing repayment delinquency of borrowers under the National Defense Student Loan Program. The sample was nationwide, drawn from 1,6/1 colleges and universities (31).
Results indicated that loan recipients who had been forced to leave the institution on academic dismissal tended to have a very high relative incidence of loan delinquency. The authors tentatively concluded that:
Because student loan recipients leaving the institution before graduation and on academic dismissal have a high incidence of loan delinquency, it follows that loan recipients coming to college with a low high school Grade Point Average, or already in college and achieving poorly, could conceivably be higher loan risks. There exists a much greater probability for these students to become academically dismissed. (3l:n.p.)
Type of Institution Attended, Ethnicity, Family Income Level and Delinquency
The type of institution a student borrower attends, the student's ethnicity and/or his family income level may be important indicators of whether or not they will default on a student loan. Acting on this hypothesis in an effort to identify trouble spots where defaults occur most often in the Federally Insured Student Loan program, the U.S. Office of Education developed a model to predict the institutional, student, and lender traits of participants. The data covered fiscal years 1968 through 1973 (38:4).
The collected data revealed that:
- The smallest proportion of default claims paid directly by the federal government in that period resulted from loans to students attending private colleges. Public junior and senior institutions accounted for the highest proportion of default claims paid annually with students at proprietary institutions a close second.
- Black students defaulted proportionally three times more than all other ethnic groups. White students, Spanish-surnamed Americans, and American Indians all had proportionally similar default rates.
- The lower the student's family income, the greater the chances of default. Proportionally, the highest percentage of claims was found in the $3,000 and below family income group; the next highest was found among student borrowers whose adjusted family income was between $3,001 and $6,000.
It was unclear at the time the model was designed whether the findings would make lenders more wary of lending to minority or low income students and/or whether the model would be of immediate use in predicting future loan defaults. Since it was based on past experience it could not take into account new rules and regulations and increases in collection personnel employed by the Regional Offices of the U.S. Office of Education.
Loan Default and Amount Borrowed; Lender-Borrower Relationship; Borrower and Type of College Attended
Increased federal government costs, lack of information regarding the extent of future federal liability implicit in new or old loan issues, increasing default rates, reduced lender participation, and a decline in the program's social efficiency and equity motivated the Office of Education to gather some substantive data about the Guaranteed Student Loan Program in 1974-75 (38:2).
Gordon and Errecart, pursuant to contract with the Office of Education, developed two questionnaires for the purpose of eliciting responses from lenders and borrowers about certain specific aspects of the Program. One of the questionnaires concerned itself with information to be gathered from individual borrowers; the other solicited information from lenders.
The sample consisted of 800 lenders (i.e., banks, credit unions, etc.) that were stratified into 13 lender categories. Ten borrowers from each lender were randomly selected.
The findings indicated that neither the number of Loans per student nor the total amount borrowed were in any way significantly related to default rate. Defaulters as a group were found to have a very loose relationship with the lender from whom they borrowed. Many of them never met or knew who or where their lender was. Defaulters, in many instances, were not found by the lender when repayment was scheduled to begin. Sixty percent of the defaulters came from families with no other account-relationship to the lender.
Nearly all of the students who attended vocational schools and eventually defaulted entered school with the intent of getting a job in their field. Two-thirds found the schools unable to place them and only 17 percent secured jobs closely related to their training.
The research group made the following recommendations to the U.S. Office of Education (39:129-133):
- Certain types of borrowers should be eliminated.
- The U.S. Office of Education should implement policy changes aimed at tracing and locating borrowers at repayment time.
- The loan collection process currently in use by the Office of Education should be considerably improved.
- Direct contact should be established between the Office of Education and all student borrowers.
- Hither the student or the school should be required to provide annual notification to lenders about changes in enrollment and address status.
- Consideration should be given to Limiting the extent to which schools or lenders participating in the Guaranteed Student Loan Program and with excessively high default rate experience are allowed to continue in the Program.
Effect of Loans on Persistence to Continue in College
George and Patricia Nash, in their study of factors possibly influencing repayment delinquency of borrowers under the National Defense Student Loan Program, found that loan recipients leaving college because of academic dismissal have a high incidence of loan delinquency (31).
Asten, in his study in 1975,attempted to "determine if the type and the amount of aid and the conditions of its administration have any effect on the student’s chance of leaving college for financial reasons and, thus, positively affect student persistence” (40:5). The dependent variable (student persistence) was calculated from longitudinal follow-up data collected in 1972 from students who started college in 1968. Students who persisted included all students who, at the time of the follow-up, satisfied one or more of the following conditions:
- was enrolled in graduate or professional school;
- had a bachelor's degree;
- was still enrolled as an undergraduate and still pursuing the bachelor's degree;
- never left college since 1968 and was still pursuing the bachelor's degree; or,
- had completed four years of undergraduate work.
The sample used was 41,356 students attending a stratified national sample of 358 institutions.Students who aspired for less than a bachelor's degree at college entry (11.4 percent of the sample) were excluded. Regressions were done separately on black students in black colleges (N=1,378), blacks in white colleges (N=1,761), nonblack women (N=17,074), and nonblack men (N=18,069). Analysis was limited to first-year college students entering in the Fall semester of 1968.
Asten concluded that:
- Students, especially men, who rely on loans for support during
college increase their chances of dropping out.
- Students who rely on scholarships or grants increase their chances slightly of completing college; however, those relying on their savings or the G.I. Bill increases their chances of dropping out.
- Participating in the Work Study Program increases the chances of students completing college.
- Married students have a good chance of completing college, if their spouses provide major financial support. (40:3)
Speculating on the negative impact of loans on persistence among men, Asten suggests:
Since estimates of dropout probabilities control for differences in financial need, such as family income and concern about college finances, one might expect men who secure loans to have an easier time getting through college simply because they have additional resources.But precisely the opposite occurs. Apparently, any short term financial advantage associated with securing a loan is outweighed by other, possibly psychological, factors. Do men who begin college dependent on loans quickly become disenchanted with the prospect of long term indebtedness, once indebtedness for the first year becomes a reality? For some men, leaving college may be a more desirable alternative than incurring further indebtedness. Whatever the reasons, psychological and motivational aspects of loans and indebtedness merit careful considerations in the development of future financial aid policy." (40:16)
Of concern to this writer is whether this psychological factor might bother students sufficiently to score lower in their classes than their ability would normally permit, and cause them to become academically dismissed from the institution. The Nash study found academically dismissed borrowers have a high tendency to become delinquent on their loans.
Speculations and Opinions Related to “Why So Much Borrower Delinquency”
Worsening economic conditions and growing disenchantment with education was cited in September, 1974, as a reason why more and more hard-pressed borrowers default (10:7). Since then numerous speculative ideas, theories, and opinions have been voiced by both critics and supporters of student loan programs as reasons why loan defaults continue to mount.
The U.S. Office of Education blamed the lack of equitable college tuition refund policies and the failure to administer them on a timely basis as one of the major causes of student loan defaults (41:6). Student groups were concerned that young people were increasingly being asked to incur large debts to defray climbing costs of education. Most of these borrowers come from deprived homes and are going to have a tougher time than most to find gainful and stable employment (42:4).
Representative Robert Michel (R.III) charged in October, 1975,that the abuses in the student loan program show the difficulty of trying to administer a multibillion-dollar federal lending program under a law written too loosely to protect either the government as guarantor of loans or the borrower (43). The following month, the Government Accounting Office (GAO) released a report charging the Department of Health, Education and Welfare with mismanagement of the $8.8 billion Guaranteed Student Loan Program (44:1). Simultaneously, a Senate subcommittee opened hearings on an alleged major scandal in connection with the Program. Investigators for the Senate Permanent Investigations Subcommittee charged that a Los Angeles, California proprietary school owner had defrauded the federal government of approximately $300,000. The Subcommittee further alleged that the school owner had made Federally Insured Student Loans through his institution, and then closed the school and left with the profits (44:1). Also heard was testimony on a related case in which an official in charge of student aid programs in San Francisco, California's Regional Offices of the U.S. Department of Health, Education and Welfare was apparently paid thousands of dollars for helping proprietary schools obtain financial aid funds. James Martin, Deputy Director of the GAO's Manpower and Welfare Division, in testifying before this same Subcommittee declared that the default rate on all loans in repayment status as of December 1, 19743, would reach a staggering 24.3 percent (44:1). Lack of "due diligence" in collecting loans and the use of poor judgment in approving them, were the Charges brought by GAO against the Department of Health,Education and Welfare.
In December, 1975,the National Student Lobby proposed to the House Subcommittee on Postsecondary Education it set maximum on individual loans to be used as a means of ridding the default-plagued FISL of institutional lenders who recruit students and allow or persuade them to obtain loans for the full cost of their education (45:1). Senator Claiborne Pell (D, RI), Chairman of the Senate Subcommittee on Education, proposed dropping lenders from FISL when their default rates exceed 10 percent. Opponents argued that such a program would hit hardest at institutions that are attempting to serve high-risk student populations such as predominantly black colleges. Other congressmen suggested changing the 100 percent guarantee of loans to only a partial guarantee if a lender's default rate exceeds a specified amount (45:1).
Texas Attorney General John L. Hill, in a statement to the Senate Permanent Subcommittee on Investigations in December of 1975:
- Blamed the U.S. Office of Education for failing to exercise proper supervision over the Federally Insured Student Loan Program, and
- Said students from low income families most often are targets of unscrupulous school operators, some of whom have obtained hundreds of thousands of dollars in prepaid tuitions before vanishing, and leaving the youths to repay bank loans for the full amount of education they never received. (46:1)
Either one or both of these factors were reasons thought to be contributors to the current high default rate.
U.S. Commissioner of Education Terence H. Bell defended the embattled college student loan program against Attorney General Hill's charges by countering that "complex laws and a shortage of staff are the reasons behind the failures" (47 2).
An audit of defaulted loans from the Hinzon-Hazlewood College Student Loan Program, made in early December, 1975, revealed that although the overall default rate on loans was about 14 percent, the no-pay rate at some colleges in the state was as high as 40 percent (48:2). On December 20. 1975, and as a result of this abnormally nigh delinquency rate, Dr. Arthur Lee Hardwick from the Dallas Regional Office of the U.S. Office of Education proposed some restrictions designed to lower the default rate. In a letter to Mr. Mack Adams, Director of the Hinson-Hazlewood Loan Program, Dr. Hardwick proposed three alternatives:
- Limiting the total amount of loans which can be made by the Coordinating Board, Texas College and University System,
- Limiting the amount of loan money available to schools with excessive default, or
- Suspending or terminating from the program those schools with excessive default rates. (48:2)
Hinson-Hazlewood Loan officials answered Dr. Hardwick's letter by saying that they would not "opt for any of the alternatives offered" (48:2). Of primary concern to Coordinating Board officials was the rationale of penalizing future students for actions determined by the default rate of former students.
In late July, 1976, the U.S. Office of Education asked the Coordinating Board to endorse a plan restricting or eliminating Hinson-Hazlewood allocations to Texas institutions with default rates over 10 percent. In early August, the Student Services Committee of the Coordinating Board, Texas College and University System, called a hearing in Austin, Texas, to allow institutions to present their sides of the issue and give the Coordinating Board an indication of what kind of action the Board should take on the request made by the Office of Education. The USOE proposal would reduce loans available by more than six million dollars and would deprive students attending institutions with high default rates from receiving Hinson-Hazlewood loans, it was said (49:1). After the hearing and further negotiations, the Coordinating Board announced in August, 1976, that the total amount of funds institutions could use for the purpose of making loans to their students would be reduced, and to each institution assigned an amount and the number of loans it could award, indexed to existing default rates. As a result, the HHLP funds for the 1976-77 academic year at some institutions were reduced to zero (50:1).
All the literature referred to in the present section was used by the investigator in designing the investigation reported herein, especially with respect to parameters for variables to be included and then instrumentation which was fabricated for collecting pertinent data. For example, most of the allegations and unsupported opinions reported on preceding pages were used as if they were cause-and-effect hypotheses to be tested by data procured in the present investigation. Findings from, as well as methodologies used by, empirical studies were used similarly in the investigative design. Net result was an inquiry much broader and more pointedly targeted than any the investigator could find reported in literature.
References
- Rudolph, Frederick. The American College and University: A History. New York: Alfred A. Knopf, Inc.,1962, p. 178.
- Rudolph, Frederick. "The Origins of Student Aid in the United States. ‘In Student Financial Aid and National Purpose, p. 1l. New York: The College Entrance Examination Board, 1962.
- Hofstadter, Richard, and Smith, William. American Higher Education, vol. 2. Chicago: University of Chicago Press, 1961, p. 613.
- Rudy, S. Willis. The College of the City of New York: A History. New York: City College Press, 1949, pp. 19-20.
- Van Dyke, George E. "Government Experience with Student War Loans," Higher Education 2 (November 1949): 61-63.
- North, Walter M. Major Trends _ in Student Assistance. New York: College Entrance Examination Board, 1971, p.1.
- Sanders, Edward. "History of Federal Involvement in Financial Aid." In Perspectives on Financial Aid, pp. 86-88. New York: College Entrance Examination Board, 1975.
- The Federal {Investment in Higher Education: The Need for Sustained Commitment. Washington, D.C.: American Council in Education, 1967.
- Guide to O.E. Administered Program, Fiscal Year 1974. Washington, D.C.: U.S. Government Printing Office, 1974.
- Winkler, Karen J. "Defaults Up,’ The Chronicle of Higher Education, September 30, 1974, p. 7.
- Morris, Milton. Director, Opportunity Plan, Inc. Conversation with the author, May 1, 1975.
- Coordinating Board, Texas College and University System. Annual Report for the Fiscal Year Ending August 1, 1966. Austin, Tex.: The Board, 1966, pp. 7-8.
- Coordinating Board, Texas College and University System. Rules and Regulations of the Texas Opportunity Plan, April 18, 1966.
- Coordinating Board, Texas College and University system. Rules and Regulations of the Hinson-Hazlewood College Student Loan Program for All Loans Made before Fall Semester, 1971, and Which Are Not Subject to the Provisions of the Federally Insured Loan Program. Revised June 29, 1971.
- Coordinating Board, Texas College and University System. Monthly Institutional Status and Loan Transaction Report, December 31, 1969, p. 8.
- Coordinating Board, Texas College and University System. Annual Report for the Fiscal Year Ending August 31, 1970, p. 10.
- Coordinating Board, Texas College and University system. Annual Report for the Fiscal Year Ending August 31, 1971, pp. 15-17.
- Coordinating Board, Texas College and University System. Annual Report for the Fiscal Year Ending August 31, 1972, p. 22.
- Coordinating Board, Texas College and University system. Annual Report for the Fiscal Year Ending August 31, 1973, p. 26.
- Coordinating Board, Texas College and University System. Annual Report for the Fiscal Year Ending August 31, 1974, p. 54.
- Coordinating Board, Texas College and University system. Annual Report for the Fiscal Year Ending August 31, 1975, pp. 48-49.
- Coordinating Board, Texas College and University System. Annual Report for the Fiscal Year Ending August 31, 1976, p. 3.
- Coordinating Board, Texas College and University System. Rules and Regulations of the Hinson-Hazlewood College Student Loan Program for Loans Made on or after Fall Semester, 1971, and Which Are Subject to the Provision of the Federally Insured Student Loan Program. Revised June 29, 1971.
- Adams, Mack. Head, Division of Student Services, Coordinating Board, Texas College and University System, Austin, Texas. Interview, May 2l, 1976.
- Wrenn, C. Gilbert. Student Personnel Work in College. New York: Ronald Press, 195l, p. 381.
- Risty, George B. "Financial Counseling." In Trends in Student Personnel Work, p. 223. Edited by E. G. Williamson. Minneapolis: University of Minnesota Press, 1949.
- Gross, Stanley J. "Financial Aid Reconsidered, ’Journal of College Student Personnel 3 (March 1962): 153.
- The American College Testing Program. Handbook for Financial Aid Officers. Ames, Iowa: American College Testing Program, 1975, p. ll.
- Wolf, Dan B. "Student Loan Delinquencies,’ Journal of College Student Personnel 4 (December 1962): 123.
- Harrington, Charles. "An Evaluation of an Emergency
Student Loan Program," Journal of College Student Personnel 5 (December 1963): 234-237. - Nash, George, and Nash, Patricia. "Final Results from a Questionnaire Returned by Aid Directors at 1,671 Institutions of Higher Education in Response to the College Entrance Examination Board Review of Federal Loans to Students." New York: Bureau of Applied Social Research, Columbia University, October 19, 1967. (Multilithed.) (A copy of this report, still in its unpublished form, was found at the Austin office of the College Entrance Examination Board.)
- Statistical Supplement to the Annual Report of the Coordinating Board, Texas College and University System for Fiscal Year 1975. Austin: Coordinating Board, Texas College and University System, December 1975, p. 173.
- Statistical Supplement to the Annual Reports of the Coordinating Board, Texas College and University System for Fiscal Year 1971 and 1972. Austin: Coordinating Board, Texas College and University System, January 1975.
- Statistical Supplement to the Annual Report of the Coordinating Board, Texas College and University system for Fiscal Year 1973. Austin: Coordinating Board, Texas College and University System, December 1973.
- Statistical Supplement to the Annual Report of the Coordinating Board, Texas College and University system for Fiscal Year 1974. Austin: Coordinating Board, Texas College and University System, December 1974.
- Pattillo, Baker. "Hinson-Hazlewood College Student Loan Items as Correlates of Repayment Records.’ Ph.D. dissertation, Texas A&M University, 1971.
- Bergen, Betsy, and others. "Do GPA and Loan Size Affect NDSL Repayments?" Journal of College Student Personnel 13 (January 1972): 65-67.
- Winkler, Karen W. "Predicting Loan Defaults," The Chronicle of Higher Education 9 (November ll, 1974): 4.
- Gordon, K. F., and Errecart, Michael. A Survey of Lenders in the Guaranteed Student Loan Program. Prepared for the Office of Planning, Budgeting and Evaluation. Office of Education, Department of Health, Education and Welfare. Bethesda, Md.: Resource Management Corp., 1975. Available as ERIC-RIE ED 15 995.
- Asten, Alexander W. Financial Aid and Student Persistence. Los Angeles: Higher Education Research Institute, Inc., July 1975. Available as ERIC-RIE ED 112 804.
- Winkler, Karen W. "Tough Rules on Student Loans," The Chronicle of Higher Education, October 21, 1974, p. 6.
- Winkler, Karen W. "Student Aid at a Crossroads," The Chronicle of Higher Education, May le, 1975, p. 1.
- "Rip-Off by Default." The Houston Post, October 15, 1975.
- Winkler, Karen W. "Student Aid Program under Scrutiny,’ The Chronicle of Higher Education, November 24, 1975, p. 11.
- Fields, Cheryl M. "Student Groups Seek Limit on Loans. The Houston Post, December 3, 1975, p. 2.
- "Hill Testifies on Loan Abuse." The Houston Post, December 11, 1975, p. 1.
- "Program of Loans Defended." The Dallas Morning News, December 18, 1975.
- "Students May Find Loan Market Restricted." The Austin (Texas) American, August 30, 1976, p. l.
- "Board Seeks Methods to Cut Loan Default Rate.’Austin (Texas) Daily Texan, August 30, 1976, p. l.
- "New Loan Proposal Deplored." The Houston Post, August 31, 1976, p. 2.
Chapter III: Findings from the Data
Introduction
The purpose of this chapter is to present the instrumentations and methodologies described in Chapter I and the findings and speculations emerging from statistical and other analyses and interpretations of the raw data.
It will be recalled that the investigator was searching for predictors of delinquent behavior by HHCSLP borrowers. Factors and/or characteristics connected with lending, borrowing, and subsequent experiences of borrowers which were suspected to be associated with delinquent/ non-delinquent behavior were identified. These served as variables which could be tested as predictors of delinquent behaviors by comparing delinquent and nondelinquent populations, either actual or assumed. Three sources were used for data: (1) opinions of Financial Aid Officers in Texas HHCSLP institutions; (2) perceptions by borrowers; and (3) recorded information on HHCSLP borrowers possessed by institutions awarding loans. The methodologies and instrumentations used in procuring data from each of these sources are delineated by Chapter I.
In the present chapter the data are displayed, and findings revealed by examinations of those data are then presented. The examination consisted in using four probes to analyze the arrayed sets of data: (a) the apparent predictive power of variables to distinguish between subsequent delinquent and nondelinquent borrowers, (b) the clustering of variables having high or low predictive power, (c) existence of explanatory deductions or derivations respecting the predictive power of some variables, (d) which, if any, variables do seem to emerge as distinctive (strong) predictors. Findings from the three sets of data are compared and collated in Chapter IV when two additional probes are addressed to the data: (e) commonalities and conflicts existing between data-source findings, and (f) emergent, if any, substantial predictors of delinquency.
Section One treats the data and findings therefrom procured as opinions (judgments) of Financial Aid Officers. Section Two reports the data and findings therefrom procured as perceptions of borrowers. Section Three does the same for institutions' recorded information on student borrowers.
Section One: Opinions of Financial Aids Officers
The data used in this section were procured by an opinionnaire instrument (Appendix, Questionnaire I), mailed to the Student Financial Aids Officer for each Texas HHCSLP institution certified as of April,1976. Mailed out were 156 requests for response; 102 completed opinionnaires were received. Distributions of eligible and responding institutions are displayed in Table l.
The 75 percent return, with no subcategory less than 60 percent, gives confidence that the returning population is representative of the total population of 156 institutions. There is, however, a slight possibility that the four-year private returnees do not mirror the total population in that cell; but since data are not analyzed in this section by type of institution, the total representation is reliable (i.e., the absence of 5 institutions can hardly affect the rankings of variables in the displays which follow).
All 102 opinionnaires returned furnished responses which were tabulated as data. Seventy-eight respondents completed every item; 24 omitted a response to one or more items. The gross total of items completed was 2,4053 the gross total of items not completed was 145. The highest N for omission of a single item was 8. Again, it is apparent that high credibility can be attached to responses reported as totals for each variable.
Table 1: Distributions of Opinionnaire Solicitations and Reternees, by Type of Institution
As a convenience to the reader, the directions to the opinionnaire respondent are now quoted:
. . .assume that two equal and large populations are made up of Texas students whose repayments were scheduled to begin one year ago. In your opinion, would each factor be more prevalent in the delinquent population than in the non delinquent one?
The choice of T as a response indicates that the respondent judges, on the basis of his or her previous experience, a factor as stated to be highly distinctive (hence, predictive) for delinquents when compared with non-delinquents. The choice of S indicates judgment that a factor is prone to be distinctive but not highly predictive. The choice of N indicates no distinctiveness for that factor. The measure employed in arriving at the composite judgment of the 102 respondents is the percent of all respondents according T, S, or N choices for each factor. (In tabulations, an additional column sums the percents of respondents choosing T and S.) Degrees of high or low discriminative power become, therefore, operationally defined as "percents of respondents choosing the respective N, S, and T options.”
The first examination is directed toward how each factor was judged as a discriminator by the respondents. Table 2 (with the factors arrayed in the order in which they appeared on the opinionnaire instrument) provides a master display of option-choices for each variable (factor).
One data feature displayed by Table 2 is that the respondents distribute themselves across all choices with respect to each 20 variables. In other words, Financial Aid Officers must differ among themselves with respect to every variable as a predictor. For example, for V-20 which received 62.8 percent T choices (the highest percent registered), 10.6 percent of the respondents chose N. The percents for S choices are 35 or above for 10 variables, but in each case the N percent is 20 or more. The prevalence of such sizeable percents of dissenters and differers can arise from a variety of causes. Whatever the cause, the percent distributions arouse some caution in interpreting the data by applying majority/minority revelations alone. At face value, the data leads inevitably to a conclusion that pooled judgments of 102 Financial Aid Officers eliminate very few of the factors from consideration by those who seek preventive measures against indicators of delinquency proneness. This interpretation is supported by the distribution of S + T proportions. In this case, 80 percent (20) of 25 factors attracted 40 percent or more of the possible judgments establishing a given factor as prone or distinctive as a predictor.
If one uses 60 percent of respondents as indicative of "consensus" on the parts of the 102 respondents, only two factors can be said to have aroused consensus when T options alone compose the referent. But, if S and T proportions are combined and are used as the referent, the "consensus" is much more prevalent (7 factors above 80 percent; l2 factors above 70 percent). The investigator is inclined to conclude that the S + T combination is a more accurate indicator of the pooled judgments of the respondents toward predictive power of the respective factors than is the T proportion alone.
The proportions of N choices display some of the Same characteristics found in the distribution of T responses. Twenty percent or more of the respondents made N choices for 18 of the factors. High variability in individual judgments is evident. In "consensus" terms, however, 6 factors appear in some contrast with the quantity of 2 for T choices. However, the key fact to be kept in mind as the pooled judgments of respondents are interpreted is that appreciable volumes of N choices are present for most of the factors showing combined S + T proportions of 60 to 80 percent.
Table 2: Optional Choices by respondents to distinctiveness of factors toward subsequent delinquency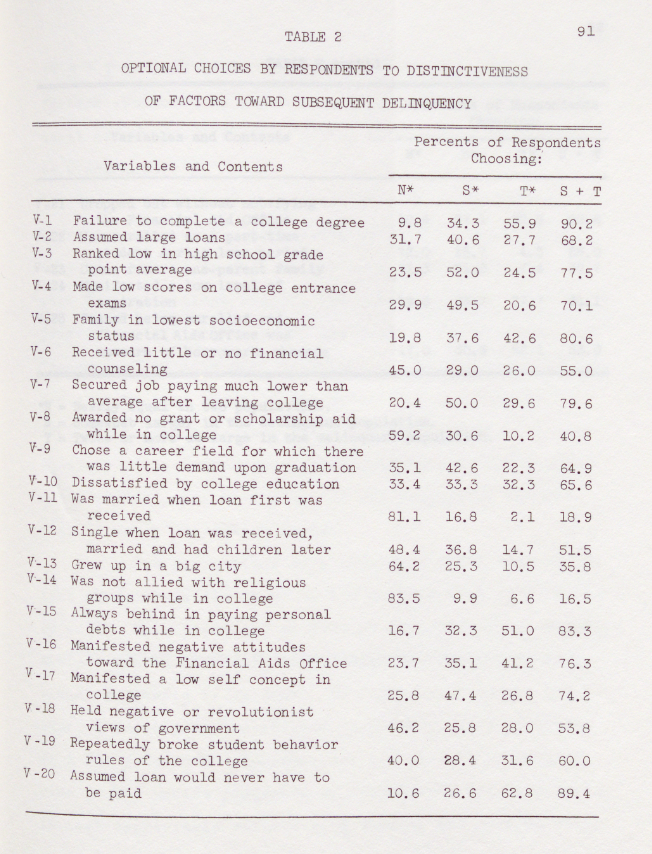
Examination now turns to the content of factors chosen with variable degrees of predictive power. To serve that purpose, the investigator chose two analyses.The first is to array the factors according to "judged degrees of predictive power." The second is to array some factors as “intertwined families" (i.e., clusters) and examine predictive power attached to each family.
An operational definition of "degree of predictive power attributed by pooled judgments of respondents" was fashioned thus:
Highly Predictive: Factors having 50 percent or more T choices and 83 percent or more S + T choices and less than 20 percent N choices.
Modestly Predictive: Factors having 70 percent or more S + T choices and 20 percent or more T choices and less than 30 percent N choices.
Non Predictive: Factors having 40-60 percent S + T choices.
Negatively Predictive: Factors having 60 percent or more N choices.
Five factors were judged by the pooled respondents to be highly predictive. They are:
V-1 Failure to complete a college degree,
V-15 Always behind in paying personal debts while in college.
V-20 Assumed loan would never have to be paid.
V-21 Dropped out without notifying Financial Aid Office.
V-25 Ceased being enrolled and Financial Aid Office was unaware of borrower's absence.
Only one of these factors, “the assumption that the loan would never have to be paid," is subject to before-loan reduction by college authorities. "Failure to complete college degree’ might be detected as incipient by Financial Aid personnel, and precautionary measures could be taken to keep in close touch with the student's whereabouts. "Absence of the student (etc.)" may reflect lack of diligence on the parts of the institution's Financial Aid Office or flaws in the college's communication system – both of which are correctable. "Credit rating" (always behind in paying personal debts while in college), if detected, might warn Financial Aids Officers against extending further loans after the first one, but the guidelines for HHCSLP are not explicit in authorizing college officials to deny loans on this basis. In sum, the highly predictive factors seem to construct a profile of behaviors by students which may be symptoms of an underlying disregard for obligations assumed; but since these "symptoms" can be observed only after a loan has been made, they do not appear very practical as screening-out devices, However, they do have some implications for counseling and other contacts with borrowers after-the-fact. These will be elaborated upon in the final chapter of the present report.
Seven factors fit the Modestly Predictive category of pooled judgments. They are:
V-3 Ranked low in high school grade point average.
V-4 Made low scores on college entrance exams.
V-5 Family in lowest socioeconomic status.
V-7 Secured job paying much lower than average after leaving college.
V-16 Manifested negative attitudes towards the financial aid office.
V-17 Manifested a low self concept in college.
V-24 Manifested a low level of aspiration.
Three of these factors (V-3, V-4, V-5) are measurable when a student's loan application is processed. Universal rejection of applications displaying these student characteristics, however, can hardly be justified–there are too many exceptions to the central tendency reflected in the pooled judgments. For example, only 24.5 percent of the respondents made T choices for "Low high school grade point averages,” and 23.5 percent exercised N choices for this variable. Obvious also is that college authorities cannot correct preentrance records of students; although the college–aware that such records exist–could attempt compensatory treatments. This would apply also to V-24,“Low level of aspiration" and V-17, "Low self concept." V-16, "Negative attitudes towards the Financial Aids Office,’may not be a discrete characteristic, but rather a compound of several other variables listed, and one is entitled to speculate that some self-protecting bias entered into choices made by the respondents. Certainly, no practicable screening-out rule on the basis of negative attitude toward the Financial Aid Office is possible. Further, while "Salary level and position secured after college (V-7)" may be causative toward delinquency, it is not useful for prescreening since it would involve subjective -and perhaps illegal–forecasts by Financial Aid Officers. The condition itself (failure to secure adequately remunerative employment) might be subject to some remediation. That possibility is discussed in the concluding Chapter of this report.
Eight, nearly one-third, of the factors presented proved to be Nonpredictive in the pooled judgments of the Financial Aid Officers. They are:
V-2 Assumed large loans.
V-6 Received little or no financial counseling.
V-8 Awarded no grant or scholarship aid while in college,
V-9 Chose a career field for which there was little demand for employment upon graduation.
V-10 Dissatisfied by college education.
V-12 Single when loan was received, married and had children later.
V-18 Held negative or revolutionist views of government.
V-19 Repeatedly broke student behavior rules of the college.
As was indicated earlier, all factors presented to respondents had been nominated as explanatory of delinquency by writers discussing the problem of delinquent behavior by ex-students. That one-third of the factors was rejected by the pooled judgment of respondents is considered of significance. However, it is clear that nomination of these factors as suspect explainers was justifiable. The median T choice percent for this set is 24.1, that for the Modestly Predictive set is 27.7, only 2.6 percentage points higher. "For some students" or "For some colleges," it appears, several of these factors are judged to be discriminative, Nevertheless, the pooled judgments fail to endorse screening or regulatory policies of uniform character as responses to the characteristics named. One possible exception is V-2, "Assuming a large loan," for which the 27.7 percent of T choices is equal to or higher than the corresponding percents for four of the Modestly Predictive factors.
Five factors, the same number as that for the Highly Predictive category, received distributions of choices which indicated them to be Negatively Predictive. That is, the percents of N choices were decidedly higher than those for S and T combined. In ordinary language, the use of these factors as screen-outs would do more harm than good to the HHCSLP. Those five are:
V-ll Was married when loan was received.
V-13 Grew up in a big city.
V-14 Was not allied with religious groups while in college.
V-22 Was enrolled as a part-time student during loan period.
V-23 Comes from a one-parent family.
Exposition now turns to examination of pooled judgments respecting the predictive power of "families of factors,"
The first family is composed of variables over which the lending institution has little, if any, control potential. Inclusion and exclusion of some of the factors in this family are debatable, and will be discussed later.
In the tabulation following, the factors are listed and the distribution of predictive power "scores" (H, M, Non,Neg) is shown.
Inclusion in this family of V-3, "High school grade point average,” is on grounds that considerations other than prospective delinquency of borrowers enter determinatively into establishing the admissions policy of an individual institution, and one cannot expect most institutions to raise their admission standards. Once a student is admitted, Financial Aid Officers would be on tenuous ground in enforcing a grade-point floor for loans other than the admission level recognized by the college. True, action by a state or federal agency could remove the institution's eligibility as a lender because of high delinquency rates, but change of admission standards is a remote possibility for most colleges. An analogous justification was used for including V-4, V-5, and V-13. For Other inclusions, an argument could be made that the college could provide services which might reduce the negative status of the variable (e.g., V-9, V-20), but the effects of such services are unknown or highly tenuous. However, some factors (e.g., V-24, V-17) were not included because of the remote possibility that college services and/or atmosphere might have a salutary effect in reducing the number of borrowers with these characteristics. Five factors listed have "Non"or "Neg" scores, eliminating them from consideration. Five of the seven factors with Modestly Predictive power are also in this family.
If, as posited, the lending institutions have little control over the presence/absence of, or slight chance for eliminating and/or overcoming these factors, any influences upon repayment behaviors must be sought elsewhere. Should "elsewheres" exist, treatment there might conceivably dispose of two-thirds of the factors chosen by the pooled judgments of Financial Aid Officers @as accounting heavily for delinquency behaviors by students. The concluding chapter of this report examines the possibility for "elsewheres."
The second family is composed of factors related to the educational devotion of individual students. The tabulation following lists the factors in this family and the respective predictive power scores accorded by the pooled judgments of Financial Aid Officers:
Two of the seven factors in this family were scored as "Non" and one as "Neg." They are eliminated from consideration. Only one member of the family received an "H" score, but three received "M" scores. "Low self concept" and "Low level aspiration" are presumably closely intertwined; neither received high proportions of T choices, however. In view of a strong suspicion that all four H or M scored items are, as factors, derivative from other factors (e.g., socioeconomic status, experience in high school), it seems doubtful that student Willed lack of devotion to education is promising territory to be attacked by institutional efforts to lessen delinquency. Attacking such symptoms as these four factors is not likely to bring about much change in students nor to reduce basic causations.
A third family is composed of behaviors chosen by students in preference to alternates available. These can be designated as student-willed behaviors. A tabulation similar to the two preceding ones follows:
The striking revelation about this family is that only four of the twelve family members received "H" or "M" scores from the pooled judgments. In fact, 3 of the le factors showed T percents less than 20. The four factors with "H" or "M" scores do loom large as predictors of subsequent delinquent behavior, in the opinions of respondents. Farlier, the investigator opined that colleges per se would be ineffective in changing what seem to be accustomed behaviors of some recipients of loans, In the concluding chapter of this report, other approaches to doing so are explored.
The fourth family is composed of factors descriptive of demographic or familial status. Such factors present perdurable, not easily manipulated influences and have been subjected to considerable research attempting to associate some of them with borrower delinquency (see Chapter II). Factor members of this family and the predictive power score for each are:
The pooled judgments of Financial Aid Officers discard these factors as positively predictive ones, with the exception of socioeconomic status, which was accorded an "M" score; that factor is apparently one with widely pervasive intertwinings, but when considered alone by respondents it ranked tenth in percent of T choices.
One further analysis was made and is to be reported next. It attempted to ascertain whether the pooled Judgments of Financial Aid Officers differed Significantly between the types of colleges from which responses came. A master display, by institution sources, of option-choices for each factor is provided by Table 3. The tabulation arrays the factors in the order in which they appeared on the opinionnaire instrument itself.
Table 3: Percents of Pooled Responses of Financial Aid Officers, by Type of Institution
Highly Predictive Factors
Four factors were judged by the pooled responses received from the various types of institutions as being highly predictive. They are:
V-2 Assumed large loans,
V-6 Received little or no financial aid counseling.
V-8 Awarded no grant or scholarship aid while in college.
V-10 Dissatisfied with college education.
In reviewing the responses given (Table 3) for each of the above factors, the investigator found some interesting differences between the responses. Respondents associated with private institutions considered "Assumed large loans" less a predictor of delinquency than did those from public institutions. Apparently, traditionally higher-cost institutions which have students who, because of necessity, incur large loans have not experienced this Characteristic as being a cause of delinquency. Public institutions, however, do consider "large loans" as a strong predictor of delinquency. Concerning "Received little or no financial aid counseling," the public two year institutions alone considered this characteristic of little importance as a predictor. The investigator assumes that, because loans awarded by two-year, low-cost public institutions are expected to be small, compared to those awarded by other institutions, two-year public institutions do not perceive a grave need for financial aid counseling. Furthermore, the reader should note that respondents from four-year private institutions cast almost twice the proportion of T votes for V-6 as did respondents at four-year public institutions. Perhaps private college administrators are more accustomed to providing strong financial aid counseling.
With respect to factor V-8, "Awarded no grant or scholarship aid while in college," four-year private institutions cast over twice the number of T votes as did any of the other institutions; and, except for four-year public institutions, they also cast over twice the number of S + T votes than the two-year and professional colleges. The investigator interprets this choice of responses from four-year private institutions as a sign of having a much greater concern for the inclusion of gift aid as a part of a HHCSLP loan recipient's financial aid package. This greater concern may stem from the need for gift aid. Financial Aids Officers at private institutions may have discovered that, if students are to meet the required high costs of attendance at these institutions without burdening them with exorbitant loan balance, gift aid must be available.
With reference to factor V-10, the analysis shows that four-year public, two-year, and professional institutions cast over 65 percent of their responses for choices S + T. Four-year private colleges cast only 43 percent of their votes for this manner. The investigator assumes that because of the high cost of attendance at private institutions and because of the weeding selection process used to admit students to these private colleges, Financial Aids Officers from these institutions cannot imagine themselves as catering to a student population that will eventually become dissatisfied with college education, and it is assumed will eventually become delinquent in their loan(s). As previously mentioned, and contrary to the opinions of private colleges, both four-year public and private institutions and two-year public institutions gave some very high marks to S + T. The differences in the manner in which respondents chose their respective responses for this factor appear to stem from the differences in their respective student populations.
Somewhat Predictive Factors
Two factors were judged by the pooled responses received from the respondents from the various types of institutions as being somewhat predictive. They are:
V-18 Negative or revolutionary views of government.
V-24 Low self concept.
There appears to be a striking similarity of choice-option responses regarding factor V-18, "Negative or revolutionary views of government" between four-year public and private institutions and also responses from two-year private institutions. All three of these different types of institutions cast a very similar percent of their choice votes for N, S, and T, with the majority of the votes being cast for S and T. The investigator assumes that since four-year institutions have historically been the sites for student unrest, respondents have known of HHCSLP recipients who were dissenters during their enrollment and who later became delinquent in their loans. No explanation can be given for the similar responses received for respondents at two-year private institutions, other than that some similar observations respecting dissenters and later delinquency may have been made by them. Student unrest at two-year public institutions has not been widespread and, therefore, a logical reason for the respondents' choice of N as a choice-option for over 55 percent of their votes.
Both two-year and four-year institutions concurred in their opinions by choosing S and T over 79 percent of the time and N less than 19 percent of the time for factor V-24, "Low level of aspiration." This united choice of responses leads the investigator to assume that Financial Aid Officers consider "aspiration level" as a very strong indicator of future delinquency and/or non-delinquency. Interestingly enough, professional institutions cast their votes evenly between N and S + T.
This concludes the analysis and comparison of responses for the factors judged as Highly Predictive and those judged as Somewhat Predictive of loan delinquency. In summary, the data show that public institutions consider "Assumed large loans" (V-2) and "Dissatisfied with college education" (V-10) as stronger predictors of delinquency than do private institutions. Moreover, private institutions considered "Received little or no 113 financial aid counseling" (V-6) and "Awarded no grant or scholarship aid while in college" (V-8) as stronger predictors of delinquency than did public colleges.
Furthermore, the data show that public and private four-year as well as two-year private colleges cast the majority of their choice votes for S + T with reference to "Negative or revolutionary feelings of government" (V-18); thus, these institutions expressed strong sentiments toward the relationship of this factor and delinquency. With respect to "Low level of aspiration" (V-24), both four-year and two-year public and private colleges agreed that aspiration level of borrowers is a key factor in their eventually becoming delinquent or nondelinquent.
Modestly Predictive
Six factors fit the modestly predictive category of pooled judgments. They are:
V-1 Failure to complete a college degree,
V-3 Ranked low in high school grade point average,
V-9 Chose low demand career field.
V-13 Grew up in a big city.
V-17 Low self concept.
V-c2 Being a part-time student.
Over 90 percent of the respondents from both the four-year and the two-year colleges were united in their opinions about factor V-1, "Failure to complete a college degree. They cast a strong majority of their option choices for S and T. A slight difference in this concurrence of opinions was in the votes cast by the professional schools; they only chose S and T 72 percent of the time.
Concerning factor V-3, "Ranked low in high school grade point average," the data show that two-year institutions consider this a much stronger future cause of delinquency than do four-year schools. Two-year colleges cast over 35 percent of their option choices for T while four-year institutions cast less than 20 percent for this same option choice. The investigator assumes that because it is well known that two-year institutions have higher student turnover than do four-year colleges, respondents are more cognizant of HHCSLP recipients who are admitted with poor high school grades and eventually fail in college and end up on the loan delinquent rolls. The data also show, however, that over 40 percent of all respondents chose S as an option choice. This choice could indicate that while two-year institutions chose T more often than did the other respondents, all of them concurred that this factor could definitely have a relationship to future delinquency.
Respecting factor V-9, "Chose low demand career field," it appears that four-year public institutions were much stronger in their opinions concerning this factor's relationship to delinquency than were all other respondents. The four-year public institutions chose T over 37 percent of the time compared to 29 percent for four-year private schools, 11 percent for two-year public schools, and O percent for professional schools. Such a disparity in the differences in percent of choice votes cast by the two groups of institutions cannot be explained by this investigator. However, the reader might note that the respondents cast a very strong choice vote of over 53 percent for S + T, indicating their unified opinion about the possible relationship of this factor to future loan delinquency.
Over 53 percent of all respondents chose N as an option choice for factor V-13, "Grew up in a big city." A still larger percent of respondents (over 59 percent) also chose N as an option choice for factor V-22, "Being &@ part-time student." This very strong united majority of votes cast for N by all respondents leads this investigator to assume that respondents do not consider either one of these two factors to be influential on future loan delinquency, and they are united in their opinions.
An interesting variation is shown for factor V-17, “Low self concept in college." Four-year and two-year public institutions chose S and T over 72 percent of the time, while two-year private colleges selected similar choices only 40 percent of the time. Also of interest are the similar scores for S + T (83 percent and 81 percent) received from four-year public and four-year private institutions, with private colleges casting a larger percent of T choice options than did four-year public colleges. Furthermore, the investigator assumes that four-year institutions selected a much larger percent S + T choices than did two-year private colleges because they consider the degree of difficulty of the courses offered at their institutions so demanding that students need to come to their institutions with a good self concept if they are to succeed academically. This notion, however, fails to explain the reason why over 72 percent of the respondents from two-year public institutions also chose S and T as their choice options. The investigator cannot find a logical answer for this, other than the possibility that respondents from these colleges may currently have some delinquent borrowers on their HHCSLP rolls whom they consider and/or assume had a low self concept while they were enrolled at their institutions.
Non predictive Factors
These last thirteen factors, accorded a Chi-square over the .35 percent level of confidence, were considered as being statistically nonsignificant in their relationship to delinquency and presumably non predictive in nature. These factors are:
V-4 Made low scores on college entrance exams.
V-5 Family in lowest socioeconomic status.
V-7 secured lower than average paying job after leaving college.
V-ll Was married when loan was first received.
V-l2 Single when loan was received, married and had children later.
V-14 Was not allied with religious groups while in college. :
V-15 Always behind in paying personal debts while in college.
V-16 Manifested negative attitude toward the Financial Aid Office.
V-19 Repeatedly broke the student behavior rules while in college.
V-2O Assumed loan would never have to be paid.
V-2l Dropped out without notifying the Financial Aid Office.
V-23 Comes from a one-parent family.
V-25 Ceased being enrolled and the Financial Aid Office was unaware of student's absence.
Three of these factors, "Assumed loan would never have to be repaid" (V-20), "Dropped out without notifying the Financial Aid Office" (V-21), and "Ceased being enrolled and Financial Aid Office was unaware of student's absence" (V-25), received over 77 percent S + T choice marks and less than 23 percent N choice marks. No particular differences were found between the percentage of N, S, or T votes cast by the respondents from the different types of institutions. Therefore, the investigator assumes all respondents concurred in their opinions about predictability that students would become delinquent if they misunderstood the repayment responsibilities of their loan or of their dropping out and/or ceasing to be enrolled. Two other factors, "Secured lower than average paying job upon leaving college" (V-7) and "Manifested negative attitude toward the Financial Aid Office" (V-16), received over 70 percent S + T choice votes and 30 percent or less N votes.Respondents from four-year private institutions gave over particular differences were found between the percentage points received for each factor from the different institutions; however, since other research has shown a relationship to exist between success in college and delinquency, the investigator expected respondents to cast higher percentage marks for T than were actually received.
And concerning factor V-5, "Socioeconomic status," the public institutions gave over 48 percent ratings to T while the private colleges had less than 37 percent. The investigator assumes that respondents at low-cost public institutions, where presumably most students come from low socioeconomic families, gave higher marks to T than those at private colleges, because their experiences have shown that many of these students accept loans and sub-sequently default. Whether sufficient numbers of students who come from high socioeconomic families attend these institutions and receive loans, thereby creating for these respondents the conditions under which they can make objective analysis about which group of students has a higher tendency to default or not, is unknown at this time.
One factor, V-15, "Always behind in paying personal debts while in college," received over 60 percent 121T choice option votes from both public and private four-year institutions as well as the two-year private colleges. Respondents at two-year public institutions cast only 36 percent T responses, The investigator assumes that the differences between these responses stem from the possibility that students at four-year institutions attend the institution for longer periods of time than those attending two-year public colleges, thereby giving respondents a longer period of time over which they can observe those students who borrow and do not pay their debts while they are in attendance. Furthermore, most of the students who attend two-year private institutions presumably domicile at the institution, while those at two-year public colleges presumably commute, giving the respondents at the private colleges the opportunity to observe students who borrow and stay behind in their debts while they are enrolled.
Three factors were judged by respondents as not being characteristic of borrowers most often found in a delinquent population. These factors were V-1ll, "Was married when loan was first received"; V-14, "Was not allied with religious groups while in college"; and V-23, "Comes from a one-parent family." The factors received 60 percent or more N choice options from all the respondents indicating a united concurrence of opinion about the little influence either one of these factors could have on HHCSLP student loan delinquency. Except for the T responses received from two-year private colleges for factor V-23, all respondents gave almost the same percentage of N, S, and T marks for each factor; two-year private institutions gave 40 percent choice T marks for this factor concerning "one-parent family" students. The investigator assumes that, since two-year private colleges have small enrollments and many of these students domicile at the institution, Financial Aid Officers become better acquainted with the backgrounds of their students than do institutions having larger enrollments. Because of this rapport, Financial Aid Officers may have, from personal experiences, knowledge of some of their students who came from one-parent families and are now on their delinquent roles. Such an observation would presumably be difficult to make at institutions with large student enrollments.
The respondents cast an almost even percentage of N as well as S + T choice marks for one of the two last factors to be discussed in this section. This factor is V-12, "Single when loan was received, married and had children later." There appears to be an obvious even split among the opinions of Financial Aid Officers as to the possible effect of postcollege marriage and student loan delinquency. The other factor is V-19, "Repeatedly broke the student behavior rules while in college." Except for the responses received from two-year private institutions, over 58 percent 8 + T responses were received from both four-year public and private institutions, two-year public colleges as well as the professional institutions. Two-year private colleges cast 60 percent N choice marks, disagreeing with the opinions of the respondents from all other institutions. The investigator assumes that respondents from two-year private colleges have either not experienced delinquency from students who broke student behavior rules or have not had a sufficient number of unruly students and are not sure of their repayment potential. The reader should note that the preponderance of the data does show that the much larger majority of the respondents does consider student college behavior as a predictor of post college student loan delinquency.
This concludes the comparison and analysis of responses received from the various types of institutions.
Summative Findings
For later comparisons with other sources of data, it is well to recapitulate the following:
- Only five of the 25 factors were accorded Highly Predictive
status employing the operational definition of the investigator:
V-1 Failure to complete a college degree.
V-15 Always behind in paying personal debts
While in college,
V-20 Assumed loan would never have to be paid.
V-2l Dropped out without notifying the Financial Aid Office.
V-25. Ceased being enrolled and Financial Aid Office was unaware of borrower's absence.
- Five other factors were accorded Negative Predictive Power status by the respondents:
V-ll Was married when loan was received.
V-13 Grew up in a big city.
V-14 Was not allied with religious groups while in college.
V-ece Was enrolled as a part-time student during loan period,
V-23 Comes from a one-parent family.
This ends Section One. Section Two, reporting the data and findings procured as perceptions of borrowers, is to follow.
Section Two: Perceptions of Borrowers
The purpose of this part of the investigation was to identify and then compare selected experiences of delinquent and nondelinquent recipients of Hinson-Hazlewood College Student loans during attendance and after they left the institution where they received their last loan. The eligible population consisted of 31,308 HHCSLP recipients who were in payout status effective August 31, 1976.Of these, 20,963 were in non delinquent status for payments and 10,345 were one to five payments delinquent in their monthly payments (1:9). Selected for a random 5.5 percent sample of the total population were 772 current and 715 delinquent accounts; these constituted 4 percent of the current and 7 percent of the delinquent population in repayment status. A larger percentage of delinquent than non-delinquent accounts was selected because it was anticipated that a smaller proportion of responses would be returned by the delinquent accounts. Distribution of the total accounts and the sample appears as Table 4 below.
Table 4: Distribution of HHCSLP Accounts in Repayment Status Total and Sample Population, August 1976
Responses were received from 4l percent of the non-delinquent sample and from 33 percent of the delinquent sample, a degree of response adequate to establish credibility for the respondent population. Additional features of the respondent sample are displayed as Table 5. The N's of the delinquent and the nondelinquent subpopulations are closely congruent, lending additional reliability to comparisons of the two for agreements and differences.
Table 5: Distribution of Responses by Type of Institution
Nature of the Data Used
The data was furnished by HHSCLP loan recipients who were in repayment status. One subpopulation of respondents was Delinquent in repayments; the other was non delinquent. The data furnished were responses to questionnaire items, identical for each subpopulation. The questionnaire instrument is reproduced in the Appendix, Questionnaire II. The items were statements of experiences borrowers might have had (a) while in college and (b) after leaving college. The "experiences" presented to respondents are reproduced as Column 2 of Table 6.
The responses treated as data were Code entries chosen by the respondent. For "While in College" experiences, the codes were: M (matches your experience); P (partially matches your experience); or D (does not match your experience at all). In designing the questionnaire, the investigator decided to insert the P code to guard against misinterpretation by respondents. That is, a respondent might otherwise interpret M as referring to "absolutely or perfectly matches," and thus opt for D. This choice would have distorted the data.
For "After leaving College" items, codes were Yes (does match your experience) and No (does not match your experience).
The data procured have one limitation. They report either memory or perceptions by the respondents with respect to most "experiences" items. Subjective fallacies may have entered into the code choices made. For example, Item One reads, “Adequate pre-loan counseling was provided." The respondent judged "adequacy" many months after the fact of pre-loan counseling, and used his or her own perception of adequacy. Therefore, we do not have here any absolute or "hard" demonstration of adequacy or inadequacy. The limitation of subjectivity upon the response data must be kept in mind at all times as the investigator reports upon his findings.
Another caution to be observed in interpreting the findings by the investigator is also explained. If the purpose of the investigator was to discover whether or not the experiences of delinquent borrowers and nondelinquent borrowers distinctively differentiated one from the other. If such distinctiveness existed, then the experiences described might be considered as somewhat predictive of subsequent delinquency or non-delinquency. The caution to be voiced is that the data are summative for each of the total subpopulations. That is, they do not discriminate between individuals in the respective subpopulations. Frequently, two individuals–one in each subpopulation–had identical code choices. Therefore, when "delinquent" and "non-delinquent" data are reported hereafter, they refer only to subpopulation summations and do not attribute experiences to each individual in a given subpopulation.
Treatments of the Data
The first task was to determine the distributions of code choices on each experience item, separately for the nondelinquent and the delinquent subpopulations. This task was done by tabulating the numerical frequencies of responses by code cells. Then, numerical frequencies were transformed into percentage distributions, item-by-item, for each subpopulation.
The second task was to compare, item-by-item, the respective percentage distributions for congruence/ difference. Naturally, "differences' dominated the scene, but it was necessary to determine whether differences were significant. To test for significance of difference, standard Chi-square (X=) methodology was used, including the standard tables for level of confidence. Chi-square is a frequently used nonparametric test. "Nonparametric, or distribution free, tests are used when the nature of the population distribution is not known or when the data are expressed as nominal or ordinal measures" (2:277).The data secured from this investigation are nominal in nature; therefore, the choice of Chi-square as the statistic is a valid one. It was decided that a level of confidence of .05 or less would be considered as indicating "a significant difference" between the two subpopulations.
When the numerical frequencies had been tabulated, it became apparent that, in many cases, the frequency of M codes was too small to permit adequate confidence in employment of Chi-square contingency tables. Champion (1970) points out:
When the expected frequency in any cell in a table is less than 5, the resulting X* value becomes an overestimate of the probability that the observed frequencies are significantly different from | chance ... . [{W]hen tables are larger than 2 x 2, "Collapsing" may be done to enlarge expected cell frequencies. (3:155)
Collapsing of M and P frequencies was therefore adopted. The collapsed choice cell is hereafter labeled M in tabulations and "matched" in textual references. This is not only permissible statistically, but it is also justifiable rationally. As pointed out earlier, one can assume that most choosers of "Partial" equated that quantity with considerable or substantial similarity, and choosers of D were declaring "Not at all" or "Quite dissimilar."
For convenience to the reader, the exact methodology employed for Chi-square calculations is now described.
When the data of research consist of frequencies in discrete categories, the Chi-square test may be used to determine the significance of differences between two independent groups (4:104). The hypothesis under test is usually that the two groups differ with respect to some characteristic and therefore with respect to the relative frequency with which group members fall in several categories. Although there may be any number of groups and any number of categories, apparently the situation that arises most often in research is the one in which we have two groups and two categories of responses (5:208). The two groups in this investigation were the group of delinquent and the group of nondelinquent borrowers. The categories varied depending on the choices of responses; some categories contained two responses, some contained three or more, The data secured are expressed in 2 xX 2, 2 xX 3, or larger cross—tabulation tables. The illustration of X© as it is used to test significance of difference in an example to be presented later will be based on acgxXx 2 table, although the method is the same for any number of groups.
Before continuing, however, it is important to present and describe the statistical formula used to determine Chi-square. The formula for X® is:
X2 = ∑ (0 - E)2
E
where: O = observed frequency
E = the corresponding expected frequency. (5:204)
According to this formula, the deviation of each observed frequency is first computed from its corresponding expected frequency and then the deviations are squared. Next, each squared deviation is divided by the appropriate expected frequency (the sum used to obtain the deviation). The remaining step is to sum these quotients; the sum is the value of X2.
The investigator now turns to the illustrations mentioned previously. Suppose an investigation is launched to determine whether there is any relation between the receipt of adequate preload financial aid counseling received by delinquent and nondelinquent recipients of long-term college student loans and delinquency. A random sample of these two groups of recipients could be asked whether they received adequate counseling while they were enrolled. They are to respond by answering "Yes" or "No."
Illustration 1 shows the data that might have been obtained, arranged in a@2 x 2 cross-tabulation table, the table shows that 58 of the 97 non delinquent recipients in the sample said they received adequate counseling; the other 39 said they did not. The question is "whether these frequencies indicate a significant difference between the two groups." The data could then be arranged in the following manner to determine X=,
When X* is used to test for the significance of difference between two or more groups, it is sometimes said to be a test of independence. Perhaps this can best be explained by pointing out that the observed frequencies in Illustration 2 are classified in two ways. One way is receipt of adequate counseling versus nonreceipt; the other way is by non-delinquency and delinquency. Our problem, stated above in terms of significant difference, can therefore be restated in the form of the question: Are the two ways of classifying the two frequencies independent of each other? If the two ways of categorizing are independent, then receipt or nonreceipt of adequate counseling does not depend on whether recipients are delinquent or nondelinquent and one could combine the borrower groups, categorizing merely on the bases of receipt versus nonreceipt of adequate counseling. This is the same as saying that the groups do not differ significantly. On the other hand, if the classifications are not independent, that is, if they are correlated, then when the data are categorized one way, the data must also be categorized another way. In the example shown in Illustration 2, the borrower groups differ significantly in their receipt of financial aid counseling.
Illustration 1
Illustration 2
The investigator will now show how X= is used to test for significant difference, using Illustrations 1 and @ as examples. The assumption null hypothesis should first be made; it is assumed that both nondelinquent and delinquent groups were drawn from the same borrower population, Note, the investigator is not concerned, for either group, whether they received or did not receive adequate financial aid counseling.
The next step is to determine the expected frequency for each of the four cells shown in Illustration 1. Since we have no prior hypothesis, the reasoning follows:
If the null hypothesis is correct, i.e., if the true (expected) frequencies are the same for both samples, then combining the two samples should give us a better estimate of the true frequencies than we could get from either sample above. Thus, the observed frequencies within each column are added to get the marginal column totals of 105 and 101. These values are used as the best estimates of the division in the single assumed population between borrowers who received adequate counseling and borrowers who responded by saying they did not. Since the total sample is 206 cases, the expected percent frequency in the population for the "Yes" respondents is 105 + 206, or 50.97 percent. In other words, the best estimate of what could be obtained if the entire population were measured would be that 50.97 percent were receiving adequate financial aid counseling. In a similar fashion, 101 + 206, or 49.03 percent of the total frequency, is the expected percent frequency for the "No" category. Remaining is the computation of the expected raw frequencies for each sample (cell); this figure is computed by dividing the sample N on the basis of the expected percent frequencies. Thus, there are 97 nondelinquent cases; since it is expected that 50.97 percent of them will fall in the "Yes" category, we compute 50.97 percent of 97, or 49.4, as the expected frequency (E) for the upper left band cell of Illustration 1. This value is shown in parentheses. Similarly, 50.97 percent of the 109 delinquent cases produces 55.6 as the expected frequency in the "Yes" category for the delinquent respondents. The expected frequencies for the "No" category cells are determined by taking 49.03 percent of 97 and 109, respectively.
Now that the expected frequency has been determined, the investigator turns to computing X* in the usual manner: each deviation of an observed ("0") frequency from its expected ("E") frequency is squared, divided by the expected frequency, and the quotients summed. An example of this procedure is shown under the column headed by the formula (O-B)" in Illustration ec. It was found that X= = 5.77 for this example. The degrees of freedom (df), however, have yet to be calculated or the necessity defined.
A general rule that can be used for determining the df for any cross-tabulation table that has at least two rows and two columns and in which the marginal totals are used in determining the expected frequencies is given next. The df for this example, therefore, equals (Number of columns - 1)(Number of rows - 1) (5:211). Therefore, in a2x2 table, the df = (2 - 1)(2 - 1), or 1. This rule applies to cross-tabulation tables of any number of rows or columns, as long as there are at least two of each. It is necessary that the df be calculated if the level of Significance is to be determined.
To evaluate the X= for this example, the reader need now refer to a table of Chi-square values at the 5 and 1 percent levels of significance. Reference to such a table shows that for 1 df, X* = 3.84 at the 5 percent level and 6.64 at the 1 percent level. The obtained X* values of 5.77 exceeds the value at the 5 percent level. The hypothesis at the 5 percent level of confidence is therefore rejected that the two groups were drawn from the same population with respect to receipt or nonreceipt of adequate financial aid counseling. The same could be said for the hypothesis of independence; the frequencies in the categories of recipients who either received or did not receive adequate counseling are probably not independent of delinquency.
Pertinent information derived from the treatments of the data which have been described is displayed in Tables 6 and 7.
Experiences of the Total Population
Displayed by Table 6 is the percentage distribution of coded responses by the total population of respondents and of each of the subpopulations. Revelations by the displays for the total population are particularly significant. They are pointed to first because they tend to eliminate from possibly predictive status several experiences which have been nominated as possible explanations for delinquency on the parts of borrowers. That is, if borrowers themselves are testifying, some kinds of experiences are so miniscule proportionally that they simply cannot account for either non delinquency or delinquency.
One rather widespread contention is that many borrowers do not know what they are taking on when they execute an HHCSLP loan. That contention is not supported by the borrowers who returned questionnaires. Ninety-six percent "said" they were fully aware that they were receiving a loan, not a grant (Item 4). Ninety percent perceived at the date of responses that long-range implications of repaying a loan were made clear to them when they received the loan (Item 5). According to these returns, college loan officers said to be at fault for not making these things clear may be falsely accused. More pointedly, if less than 10 percent of borrowers had an experience of not being clearly informed, one can hardly reduce delinquency rates very much by eliminating this particular deficiency.
Neither does it appear that over leniency with respect to size of indebtedness assumed can be attributed to the loan officers who dealt with this population of borrowers. Only 10 percent experienced a concession of judgment (Item 6) with respect to the size of the loan awarded and 35 percent assumed a loan smaller than he or she was eligible for (Item 7).
Table 6: Percentage Distributions of Experience Item Codings for Total Population and Nondelinquent and Delinquent Subpopulations
Table 7: Differences in Experience Codings Distributions between Nondelinquent and Delinquent Subpopulations
A third "cause" commonly alleged is that borrowers, after leaving college, become disenchanted about the current values of the loan in their scheme of things. The resounding percentages rejecting this assumption (Items 8-11) do not testify to disenchantment, it seems certain.
Some allege that being out of a job may explain delinquency in many cases, but 89 percent of these borrowers were in full-time employment families (Item 18).
It is the opinion of the investigator, based exclusively at the present upon perceptions by borrowers, that the foregoing items of experience might as well be dropped by those searching for causes which, if eliminated, could significantly reduce delinquency rates. Their proportionate presence is too small to forecast appreciable gains in loan repayments.
In addition, as an introduction to reporting upon statistical significance for differences between distributions by subpopulations, the investigator issues a caution. There may be a distinction between a pragmatic and a statistical significance. Item 5, for example, will show a statistically significant difference between sub-populations. But, with only 10 percent of the total respondents in the D cell, its pragmatic position as a fore- caster is questionable. Falling in the same category are Items 10 and ll.
Distinctive Differences between Subpopulations
Attention now turns to the major purpose of the questionnaire inquiry to HHCSLP borrowers, that of discovering distinctive differentiations, if any, between experiences of a nondelinquent subpopulation and a delinquent one. The information procured by treatments of the data is displayed by Table 7.
Perhaps the most impressive revelation is that of the 20 experience items on which differences in distributions of coded responses could have occurred, only 9 generated differences within the .05 level of confidence. One more (Item 16) was significant at the .10 level of confidence. Therefore, an inescapable conclusion is that one-half of the experience items (which, it should be recalled, were based upon reported allegations that these experiences are causative toward borrower delinquency) are not predictive of non-delinquency or delinquency. Neither was it possible to find that any combination of 2 or 3 of these items resulted in subpopulation differences which were significant at the .05 level of confidence. The experience items which are discounted as predictors are now listed:
4. I was made fully aware that 1 was receiving a loan and not a grant.
5. The college advisor suggested a smaller loan but approved a larger one at my request.
7. I assumed a smaller loan than the one] was eligible for.
8. The loan played a crucial role in enabling me to pursue my college education.
9. I think it was necessary for me to secure an HHCSLP at the time I did.
12. I have married since I received the loan.
14. I received HHCSLP loans through two or more colleges.
15. I worked for pay during most of my college career after receiving loan(s).
18. Full-time employment is now held by me and/or my spouse.,
19. At least one of my loans was co-signed.
Three of these refer to experiences while in college, 7 to experiences after leaving college. 1t is not considered necessary to paraphrase further the "possible causes for delinquency" which seem to be blind alleys for curing delinquency, according to these data. 1% should be pointed out, however, that Items 4, 6, 8, 9, 14, and 18 produced essentially one-code responses from both subpopulations. That is, 12 percent or fewer of the respondents chose the negative type of experience (see Table 6). This. Choice underwrites still further the nonviability of causation hypotheses some have advanced.
The exposition now turns to the 10 experience items on which the two subpopulation code responses did manifest statistically significant differences.
Preloan Counseling. The reader might remember that we are dealing here with post hoc judgmental perceptions by respondents; it is clear that the delinquent population "received” inadequate preloan advice in decisively higher proportions than did the nondelinquent. The levels of confidence for differences on Items 1, 2, 3, and 4 are very questioned at two points. For one, all four of these experiences were stated positively (i.e., "was adequate," etc.); and the proportions of the delinquent population choosing the M code were 62, 45, 60, and 85 for the respective items. It is questionable to deduce that receipt of "inadequate" pre loan counseling characterizes the while-in-college experience of future delinquents. Second, it seems unlikely that the pre loan counseling provided to non-delinquents differed sharply from that provided to delinquents. By and large, the two subpopulations came from the same colleges over the same span of years. It is true that the "same" counseling might have differed in its impact upon the nonprone and the prone toward delinquency, but this investigator suspects that the presence of non-delinquents in higher proportions within D cells is attributable to personal characteristics and/or circumstances at the time of response more than to the actual nature of the advice received. Nevertheless, the data alone seem to support a contention that inadequate (as perceived) pre-loan counseling is associated with the prevalence of subsequent delinquency.
Current Life Attitudes. Items 10, 11, and 20 deal with after-the-fact attitudes toward previous borrowing behavior, Several writers speculate that disappointments and disillusionments with respect to what college education would do for the individual spawn repayment delinquency. The data, as treated, seem to support this speculation to some degree. The proportions of delinquents accounting for low-value attitudes toward the loan's pay-off were significantly higher than those of nondelinquents. However, exceptions to this conclusion exist. For Item 11 ("Wish I had not accepted a loan"), 73 percent of the delinquent subpopulation chose the "No" code. For Item 10 ("A good investment'), 90 percent chose "Yes," and for Item 20 ("Could have got by on less"), 71 percent chose "No,". These facts clearly contradict the notion referred to above, and emphasize the observation made earlier that statistical (i.e., Chi-square) significance and pragmatic significance may be quite different in some cases. The investigator's conclusion is that these items have little practical value in giving leads to remedial action with respect to delinquency.
Circumstantial Alterations. Items 13, 16, and 17 presented hard-fact changes in the individual's circumstances since the loan contract was signed. Such ¡items loom large in the popular-language of "explanations" for loan defaults. Item 16 ("Receiving a college degree”) produced a difference between the two subpopulations which reached only a .09 level of confidence. Two-thirds of the non delinquent subpopulation had completed a degree; three-fourths of the total population had done so. Again, the proportions involved here give little indication that completion/noncompletion is usefully predictive of repayment delinquency. Item 13 (added dependents), produced a significant (.004 level of confidence) and an intriguing difference. Twenty-eight percent of the non delinquent population had added two or more dependents, compared with 43 percent of the delinquent population. One could speculate that new dependents include a sizeable proportion of spouses who are also wage earners, but the investigator cannot substantiate this idea. At least, however, the facts tená to discredit the notion that "having more mouths to feed" is a pervasive cause of repayment delinquency. Item 20 ("Could have gotten by with a smaller loan") results are subject to the same fallacy pointed to several times already; the vast majority of each subpopulation chose the "No" code. With 83 percent of the nondelinquent and 71 percent of the delinquent sub- populations choosing a "No" response, the practical value of the statistical difference is lessened. That is, the "Yes" respondents are of proportions so small that across- the-board changes in HHCSLP regulations or methodologies are hardly indicated.
Recapitulating conclusions from the evidence presented by Section Two are not offered at this point. They appear in Chapter 1V. It should be said, in closure, however, that the investigation described and reported upon in Section Two is notable and valuable chiefly in terms of what is demonstrated. No pragmatic distinguishing differences between the two subpopulations were found.
Section Three: Recorded Information on HHCSLP Borrowers
The data used in this section consist of student borrower characteristics obtained from official student records at the institutions where they received their first HHCSLP loan. A random sample of 578 student borrowers was drawn from the 1,600 HHCSLP borrowers used for the Student Experience investigation (Section Two). The sample contained subpopulations of 283 delinquent and 2905 non delinquent borrowers. To insure that the sample was representative of the population, a T-test was performed. To make the test, one "characteristic"” variable was used, that of the average amount borrowed. Data derived by a two-tailed T-test of significance are displayed as Table 8. The T-test reveals that a .0l1 level of confidence exists that the sample used would be the same as any other random sample of the same size from the population,
The individual borrowers in the sample were traced to the respective institutions from which the first HHCSLP loan was received. This resulted in a population of 122 Texas institutions which, presumably, had on file data respecting the persons composing the borrower sample. The numerical distribution of these institutions by type appears in Table 9. The N in each type-cell constitutes a credible sample of the type, with the exception of 2-year Private Colleges.
A solicitation for desired data on borrowers in the sample was mailed by the Coordinating Board, Texas Colleges and Universities to the Student Financial Aids Officer in each of the 122 institutions. The solicitation pieces are reproduced in the Appendix as Questionnaire III. Data were procured on 207 (73 percent) of the delinquents and 232 (79 percent) of the nondelinquents in the sample. While one or more of the data bits requested were omitted in some returns, less than 5 percent of the data bits were missing for any one category of data. In sum, the data handled were sufficient to establish confidence in the distributions reported subsequently. Details respecting the composition of the sample and the response population are displayed as Table 9.
Table 8: T-test of statistical significance, population sample
Table 9: Institution and borrower samples and responses, by type of institution and borrower subpopulations
Data Sought
The investigator was familiar with the data usually required by HHCSLP regulations to accompany application for a loan, and also with data on students typically stored by Registrar or College Records offices. He took the "suspect" factors associated with repayment delinquency (used in designing the Opinions of Financial Aid Officers investigation and the Perceptions of Borrowers investigation) and searched out presumably recorded "characteristics" which could serve as proxies for some of these factors. The factors and the corresponding proxy data are:
The precise requests to institution officers for proxy data appear in Questionnaire III, in the Appendix.
It can be seen that factors being tested by this particular investigation were largely demographic. That is, they deal with "causations" which are chiefly impersonal in the sense of not being remediable by personalized actions. For example, there are no factors addressing the nature or extent of preloan counseling by Financial Aids Officers or with the perceptions of borrowers. Also, most factors being measured by proxy data were operative prior to making the loan; only Factors 1, 7, 10, 12, 13, and 14 were in-college happenings.
Treatment of Data
Treatments were dictated by the necessity to compare the two subpopulations, non delinquent and delinquent, in such fashion that the predictive potency of each factor could be determined. The data lent themselves to "yes-no" reduction in most instances. For example, a borrower was shown to be either part-time (Yes) or full-time (No). However, for some factors the proxy data could not be reduced with validity to "Yes-No" form; frequency distributions between two or more degrees of freedom had to be compared. An example is the "Early borrowing" factor, where the proxy data would show freshman, sophomore, junior, or senior rank when the first loan was received.
First, numerical frequency distributions, by each subpopulation, between each degree of freedom for each factor were made by the computer program used. These were then transformed into percentage distributions of two types: (a) the percent of each subpopulation allocated to each degree of freedom, and (b) the percent of each subpopulation accounting for the N of each degree of freedom. Utilizing these basic derivations, the computer then calculated Chi-squares comparing the two subpopulations and the index of statistical significance of the differences in distributions for the two subpopulations for each factor.
Revelations by Proxy Data
Did the two subpopulations differ substantially from each other with respect to the factors proposed as "suspect" in explaining delinquency? The treatment-derived data displayed by Table 10 furnishes a preliminary answer, only two of the factors produced statistically significant differences within a .05 level of confidence. One difference evoked a .1l level of confidence, sometimes accepted as "significant" for random samples of large populations. However, there might be more predictive potency in the data received than can be yielded by statistical summations, the investigator reasoned, and he now presents further analyses and deductions. Presentation will be factor-by-factor.
Table 10: Differences between delinquent and non delinquent subpopulations, by factor, as measured by chi-square tests
- Urban Morality. The contention establishing this factor is that dwellers in big cities tend to have less commitment to honesty. The validity of that assumption could not be tested by the investigator, of course, but the efficacy of it could be assessed by simply finding out whether the sizes of home cities of borrowers varied between the two subpopulations. The name of each first borrower's city of residence was supplied by respondents. Sizes were classified as 25,000 or below, 25,001 to 50,000, 50,001 to 100,000; 100,001 to 250,000; 250,001 to 500,000; above 500,000. Census (1970) figures for cities were looked up and tallied in the proper classification. The tabulation following displays the percents of non delinquent and delinquent subpopulations in each size classification.
Obviously, future delinquency is no respecter of home-town size. In fact, there is no evidence here to support even a suspicion that this factor is one in a cluster which might predict non repayment ethics; the distributions are almost congruent (Chi-square approaches 1.0). This fact does not prove that disrespect for debts is absent from life-style cultures of many borrowers, of course, but proves convincingly that such cultures are not a function of city size. This factor is clearly a non-factor for predicting delinquency.
- Part-time Studenthood. The suspicion establishing this factor is that part-time students are getting a loan to eke out their income and that, in turn, makes college work too straining and unsatisfying and probably results in a low-scale placement of repayment obligations.Again, the accuracy of this speculation could not be tested directly by the investigator. But, if the proportion of part-timers in a delinquent subpopulation is larger than that in a nondelinquent population, the speculation might be worth examining further. The proxy data here were of "yes-no" variety. The non delinquent subpopulation included 7.5 percent part-timers; the delinquent subpopulation, 3.03. The difference between these yielded a .11 level of confidence, but a far more impressive fact is that 94.4 percent of the total population of borrowers were in full-time status. Even as a factor reinforcing other factors, part-timers are hardly worth exploring any further, it seems to this investigator. Extrapolating from the sample population to the gross population (31,308) of HHCSLP accounts, only 1,753 part-time students are in that gross and 614 of these are in "current" repayment status–leaving only 1,139 to be subjected to remedial action. If part-timeness is a sort of catalyst encouraging repayment delinquency, it must be a very mild one.
- Youthfulness. "Eighteen-year-olds are just too young to realize the consequences of taking on a loan of HHCSLP size," this suspicion runs– implying that a "cause" for delinquency therefore exists. The furnished ages of borrowers ranged from 16 to 50; they were classified as follows: 18 or below; 19; 20 to 22; 23 to 27; 28 plus. The percentage distributions of the populations to these classifications were:
These distributions clearly dispose of the "youthfulness'” factor as a causative predictor of subsequent delinquency or of subsequent non-delinquency. The Chi-square of 8,530 is substantiated; cooccurrence of age with repayment behavior is negligible and the chance that age at first loan is of consequence in influencing repayment status several years later is tiny.
- Early Borrowing. This suspicion is that a freshman who borrows has strong and rational commitment to securing a college education, and hence is likely to repay the loans secured. The data procured made it possible to show the percent of representation in the two subpopulations of borrowers whose first loan was secured when a freshman, a sophomore, a junior, a senior, and a graduate student in rank. These percent derivations are tabulated below:
Freshman borrowing is clearly nonpredictive of delinquency. Sophomore borrowing might be faintly predictive (index of confidence in the difference is .31). Twenty-six (7 percent) of the total borrowers took out their first loan as seniors. The higher proportion of nondelinquents in this N is statistically a predictor of non-delinquency, but the small N downgrades its practical significance. In sum, early borrowing does not predict either delinquency or non-delinquency. The most useful finding here is that 62 percent of all first loans were made to freshmen and 79 percent to freshmen or sophomores. The absence of HHCSLP would, apparently, deny college opportunity to large numbers of ambitious high school graduates, the majority of whom prove they can earn a college degree and who will repay their loans.
- Impoverished Family. The argument back of this factor is that "poor people are so accustomed to welfare handouts that they don't take loan obligations seriously," hence people from poor families are bad risks for HHCSLP loans. The investigator thinks the argument is false, but at least he could demonstrate whether “poor families" characterized a higher proportion of delinquents than of nondelinquents. The proxy family income data were classified and tallied to 5 classifications: (a) $1,000 or less, (b) $1,001 to $4,000, (c) $4,001 to $7,000,(d) $7,001 to $10,000, (e) $10,001 up. Percents of representation in three collapsed classifications are now shown:
The Chi-square of 5,4093 for this factor was based in a comparison of the two subpopulation distributions with 5 degrees of freedom, and yielded a confidence index of .25 that the distributions were different. The percent display above pinpoints and accentuates a significant difference. A significantly higher proportion of delinquents (N=89) than of nondelinquents (N=81) were from "poverty income" families. A significantly lower proportion of delinquents (N=17) than of non delinquents was in the $10,001: and above income levels. These facts combine to produce predictive potency at a .16 level of confidence–still weak as a basis for cause-effect conclusions, but enough to merit consideration. Two cautions accompany the interpretation just made. One is that 47 percent of the "poverty income" borrowers were repaying their loans. The second is that the evidence contributes no validity or non validity to any given argument as to why the difference discovered does exist.
- Dependent Load. Borrowing to take care of family welfare, it is said by some, lessens determination or ability to repay in-college loans. The proxy data here have three defects: (a) all dependent load (i.e., children) may not appear; (b) the "load” is measured at date of loan, not at date of leaving college; and (c) dependents can be wage earners. Although data on "Divorced” and "Widowed" status were procured, they may be disregarded, since only 7 percent of the total population fell in these categories. Percents of representation in "married" and "single" classifications were: Married, 29.2 non delinquent and 35.2 delinquent; Single, 62.4 non delinquent and 57.7 delinquent. Being married at the date of loan is not a predictor of repayment behavior, it seems certain.
- Drop-out before Degree. This factor is strikingly predictive of delinquency. A level of confidence of .003 is phenomenal. The fact that the proxy data do not include degrees earned by borrowers after leaving | the reporting institution should be noted, but addition of such information could not affect the level of confidence appreciably. The percents of representation accounting for the difference are:
The split between delinquents earning and not earning degrees seems near-even, but it should be recalled that 5.8 percent of delinquents executed their first loan as graduate students and hence were included in the "degree" column. Actually, the data measure drop-out behavior, and it is clear that drop-outs are much more prone to be members of a delinquent subpopulation than a nondelinquent one. The import of this finding for remedial action toward rates of borrower delinquency is addressed in Chapter IV.
- Female. Are females poorer credit risks than males? Even if they are, would administrators of the HHCSLP dare regulate women out of eligibility? Fortunately, the second question does not have to be raised because of the answer to the first. 0f the individuals who received loans, 60 percent were male, 40 percent female. Of the delinquent subpopulation, 59 percent were male, 41 percent female. The total population of females, by the way, was no more prone toward being drop-outs than was the male population. Hence this factor is nominated for oblivion in any further searches for factors predicting delinquency.
- Poor High School Student Record. The proxy data allocated each borrower to one of four quartiles in high school grade point average. The fallacies in such statistics are recognized by the investigator, but do not appear as serious flaws in the light of the purposes for which the data were used. The computer program used compared the distributions among quartiles of the non-delinquent and delinquent populations. The distributions were different, but the difference was at a .28 level of confidence. The percents of representation point to findings not made evident by the summation:
The foregoing array reveals rather firm confidence for a "prediction" that being in the lowest quartile forecasts non-delinquency rather than delinquency. Being in the lower half (1 + 2) is an even more confidence-meriting forecast that a borrower will be non delinquent. And, the highest quartile population is composed 44 percent by future nondelinquents and 56 percent by future delinquents. "Poor high school student record," therefore, turned out to have considerable predictive potency–but for non- delinquency, not for delinquency. And, to be somewhat facetious, borrowers in the highest quartile are slightly more likely to become delinquent than nondelinquent.
- Loans Too Large. The proxy data for this factor was the total dollar size of the loan or loans awarded by the responding college to each individual borrower. This information was procured for 393 borrowers and can be considered representative of the borrower and the institution population. Seven size-cells were used to classify the collar sizes reported. The total distributions of the size in the two subpopulations were found to be considerably different, and the differences produced a .31l level of confidence. That, of course, does not answer the basic question. The question is whether borrowers having large-size Joans were more likely to be delinquent than those receiving small-size ones. The percent representations which follow do provide an answer. The difference between representation percents in the large loan category is indeed significant, with a level of confidence index of.18. However, when the extremes of $500 or less and $4,000 or more are compared, there is no significant difference. The Ns for these two categories are 39 and 25, respectively, and the credibility of comparison results is therefore limited. But, this latter evidence causes the investigator to conclude that the "large loans” factor is modestly but not strongly potent in predicting future delinquency.
- Low College Aptitude. This factor is taken up out of order because of its overlap with the one preceding. Proxy data were SAT or ACT total scores. These were provided for only 165 individuals (53 SAT; 112 ACT), and are not a representative sample of the borrower population nor of the college population. The scores were allocated to four classifications: L (Low), LM (Lower Middle), UM (Upper Middle), and H (High). The computer program compared total distributions of the two subpopulations and found a very modest difference which had a confidence index of .69. The percent representations are now displayed:
The subpopulation differences thus revealed are nonsignificant in the pragmatic sense. There is no evidence in this limited sample that low entrance exam scores (the proxy for college aptitude) can predict, either way. The evidence does not corroborate that for high school quartile placement, but neither does it rebut that evidence. The lower (compared to high school grade point averages) percents for the L category above, by the way, mean nothing; the classifications themselves are not comparable. One cannot recommend "Low college aptitude” for oblivion in future searches because the data are too scanty. But this factor is denoted nonpredictive for the present report.
- Too Much Grant Aid. The Proxy data requested was whether or not the borrower was at any time after receiving a loan also receiving other financial aids. Admittedly, this "measure" of the factor stated is somewhat tenuous. "Other financial aids" reported could have been other-source loans or work-study, not grants. The dollar-size of the reported aid is unknown. Aid of similar character from private sources might not have been reported by the borrower, However, odds are favorable that the data do index adequately the prevalence of give-aways in the borrowers' scheme of things, the investigator opines from his own observations. The Chi-square of 4.130 and the .042 level of confidence indicate strong predictive power for a "Yes" answer to "Received other financial aids.” But, the prediction is that of non-delinquency, not future delinquency.The percent representation of nondelinquents in the "Yes" column is 58.4; that for delinquents is 47.6. The hypothesis back of the wording of the factor statement, "accustomed to treating aid as a give-away,' is not supported. Nevertheless, receiving other financial aid emerges as predictive of delinquency in an upside-down role: failure to receive such aid is discriminatingly predictive of future delinquency.
- Multiyear Loans. This factor is taken up out of order because ov its overlap with the preceding one. The subpopulation distributions on multiyear loans were sufficiently different to yield a level of confidence index of .186. The percent representations reveal considerably more about the discriminative adequacy of this factor as shown on Chapter Three Section Three: “13. Multiyear Loans”. The striking fact revealed by the display is that "Multi-year" is a misnomer for actual practice. That is, 43 percent of borrowers received only one loan, and only one in four of the borrowers received more than two loans. Borrowing is not an addiction of HHCSLP beneficiaries, and lending is not an addiction of institutional loan officers, it appears. Also, the Ns for three, four, and five years are small, producing lowered credibility for the percentage differences which largely produced a level of confidence index as favorable as .186. Delinquent percents for £ years and 3 years are lower than nondelinquent percents. Added together, all of the foregoing leads the investigator to conclude that (1) total loan size cannot be a function of the number of annual loans beyond two executed, (2) number of loans is not predictive of either delinquency or non-delinquency, and (3) this factor can be safely consigned to oblivion in future investigations.
- Institution Type. This factor is not stated pejoratively, but its presence is accounted for by contentions such as "Private colleges are overgenerous with loans,” "Two-year institutions do not provide enough financial-aids staffing,” "State universities have selective admissions and community colleges take anybody."
Such contentions have validity with respect to loan delinquency only if the types of institutions differ from each other in proportionate representation of non delinquent and delinquent subpopulations. "Types" were classified as: (1) 4-Year Public; (2) 4-Year Private; (3) 2-Year Public; (4) 2-Year Private; (5) Other. Comparison of the total distributions of nondelinquent and delinquent sub-populations between the foregoing institutional types demonstrated very small difference, resulting in only a .870 level of confidence that there was any real difference. The percents of representation support this finding fully. No pair of types had percent representations from delinquents which differed by 6 percentage points or more, Type of Institution can be dropped from further consideration as a possibly explanatory influence.
However, one revelation was made by the raw (institution-by-institution) data which may have high pragmatic import. Within the population of colleges in each type (except 2-Year-Private; N=4),were institutions whose percent representations of delinquents were significantly higher than the mean for that type and the mean for the total population. Causations for this phenomenon are not revealed by the evidence, but the total incidence of delinquency in the sample could have been reduced by 6 percentage points if these institutions had been at the mean for their type. There seems to be operating some institutionally individualized set of influencing factors which merits further investigation.
- Institution Largeness. For the total distribution of the subpopulations, the computer program produced a Chi-square of 1.889 and a level of confidence in the small difference of .756. The percent representations in the two smallest and the largest enrollment-size categories were:
The difference in percents of delinquents between the very small and the largest is abstractly significant here, but still of modest proportions for a binary comparison. The N of 500-or-less institutions was 19, that for 4,000 plus institutions was 49. One has here enough evidence to change the "Nonpredictive" rendering by comparison of total distributions to one of "Mildly Predictive" for very large institutions, when compared to very small ones. However, any pragmatic import of this change is not perceived by the investigator.
- Hometown Institution. Some suspect that hometown enrollees will produce a population skewed toward higher proportions in the lowest socioeconomic class. The investigator does not concede that, even if this held true, rates of delinquency would be affected. He felt, however, that hometowners should be tested as a predictor by comparing subpopulations consisting of hometown and non-hometown borrowers. For this binary comparison against the criterion of non-delinquency / delinquency, a Chi-square of 0.464 resulted, indicating a suspect difference, with a 496 level of confidence. The hometown subpopulation was 139 (32.9 percent of the total population), and the non-hometown population was 283 (67.1 percent of the total).Hometown subpopulation composition was 50,4 percent non-delinquent, compared to 54,4 percent for the non-hometown. Clearly, this distribution negates any further consideration of hometownness, per se, as a potential predictor of delinquency in spite of the statistical rendering.
Predictive Potency of Factors Investigated
This section is now brought to a closure by a terse recapitulation of factor-by-factor predictive potency, produced by the investigator's interpretations of the revelations made by the treated data. FEach statement should be read as modified by, "Within the limitations of the proxy data used." The recapitulations are in tabular form:
In Chapter IV, the three separate investigations are collated and results compared. Some derivations based on Section III in ¡¿juxtaposition with Sections One and Two are also presented there.
References
- Coordinating Board, Texas College and University System. Monthly Institutional Status and Loan Transaction Report, August 31, 1976, p. 9.
- Best, John W. Research in Education. Englewood Cliffs, N.J.: Prentice-Hall, Inc., 1970.
- Champion, Dean J. Basic Statistics for Social Research. Scranton, Pa.: Chandler Publishing Co., 1970, Po 155.
- Siegel, Sidney. Nonparametric Statistics for the Behavioral Sciences. New York: McGraw-Hill Book Co.,195296.
- Underwood, Benton J., and others. Elementary Statistics. New York: Appleton-Century-Crofts, Inc., 1954.
Chapter IV: Summations and Derivations
This closing chapter has three sections. Section One summates the findings derived from the search for factors or situations predictive toward delinquency in HHCLSP repayments. Section Two presents derivations from the three sub investigations which are designed to be useful information for (a) the policy formers for the HHCSLP and/or (b) the institutional administrators of student loan programs. Section Three addresses the opportunities for rewarding further research directed toward explaining and/or controlling delinquent behavior toward student loan obligations.
Section One: The Search for Predictive Factors
In contradistinction from most inquiries, the investigation reported upon used three quite disparate sources for data. Each source was exploited on a larger scale than is typical, and in each case the source was probed by prefabricated suspect factors. Deliberately, some suspect factors (differently worded) were presented to two or three sources. In other cases factors were appropriate for only one source. In all, 33 discrete (or semi-discrete) factors were used as probes. As readers of Chapter III now know, the data procured contained wide ranging implications for matters other than the mere predictive potency of factors or conditions. These implications will be treated in Section Two of the present chapter. However, the obsessing priority in processing and interpreting the data was that of identifying cooccurrence between the existence of a given condition or factor and the existence subsequently of loan repayment delinquency. The present section summates and interprets the findings with respect to that priority only.
The investigator wants to reemphasize the basic nature of the findings made. They do not apply to individual borrowers. It is quite clear that, for every factor, condition, or experience present, many individual delinquents and nondelinquents were alike. The findings report only upon aggregated subpopulations of delinquent and nondelinquent borrowers. To be as explicit as possible, the findings do not say that "delinquents are like this and nondelinquents are like that." They do say, and that only, "odds are that in two subpopulations of delinquent and nondelinquent borrowers one will find that ..." Hence, "predictive" refers only to odds that a higher proportion of a delinquent population of borrowers are characterized by "X" than is present in a nondelinquent population.
For summative purposes, "predictive potency" of a given factor, condition, or experience is defined as "the odds derived from comparing the two subpopulations with respect to this variable." Four degrees of potency are employed in categorizing the findings. "Strongly predictive" connotes that odds are so high that one can be sure that the characterizing variable is more prevalent in a delinquent subpopulation than in a nondelinquent population. "Considerably predictive" connotes a finding that prevalence was greater in the delinquent subpopulation, but odds are such that one cannot be sure the difference (a) is enough to have practical-action implications, or (b) would be repeated if the borrowers were individuals other than the ones populating this investigative foray. "Mild predictive potency"” connotes that purely statistical odds that the variable characterizes the delinquent subpopulation are negligible–unless further investigation reveals that the variable is a member in a multifactor syndrome, "Not predictive" connotes that odds are even, and/or negative, that the prevalence of the variables in any delinquent subpopulation has any statistical or pragmatic significance.
In addition to factors, conditions, and experiences as variables, summation must also recognize the existence of another set of variables in the investigative de- sign. This set is composed of the sources for data—the opinions of Financial Aids Officers, the perceptions of borrowers, and objective recordings by lending institutions. The basic reason for using multiple sources was to include a relatively complete universe of suspect factors, conditions, and experiences. No one source could provide for that. Another reason, however, was a semi-hypothesis of the investigator that different sources would yield differing data on prevalence of a given variable in the two subpopulations. If two or three sources are corroborative, it was reasoned, greater reliance can be attached to these odds than to odds which are single-source in origin. On the other hand, if two sources are opposite in prevalence data, confidence in the odds for each drops. Both of these circumstances did transpire. Corroboration by two or more sources eased the investigator's task of summation.Conflict between sources made it more difficult. The investigator's subjective analysis and judgment had to be relied upon for a summative choice with respect to the predictive potency of the variable in question.
Summation results are displayed as Table 11. The 33 variables (discrete factors, conditions, and experiences) appear in a column headed "Factors." For convenience to the reader, they are arrayed under section headings of "Strongly Predictive," "Considerably Predictive," "Mildly Predictive,” and "Not Predictive" as summatively judged by the investigator after weighing the other data presented in the table. The second column designates the source(s) from which data for each variable were procured. The third column reports the degree of predictive potency reported, in Chapter III, for each source furnishing data on the respective variables (a blank for a given source indicates no data for that variable was furnished). The last sub-column, headed "G," reports the degree of predictive potency arrived at by the investigator's subjective judgment.
The Subcolumn "G" Entries: In most cases, these entries are identical with by-source entries. For variables 4, 9, 11, 23, 29, 32, and 33 the G-entries departed from by-source entries. None of these departures were due to "averaging." Instead, they resulted from reasoning by the investigator. Item 23 is an example. Financial Aids Officers, in majority, furnished an opinion that borrowers who thought the Joan would not have to be repaid would be proportionately more prevalent in a delinquent than in a non-delinquent one. But, an overwhelming percent of borrowers testified that they assumed from the outset that the loan would have to be repaid. In effect, the proposition presented to Financial Aids Officers was a non-condition for all practical purposes (the very act of trying to spot the condition among applicants for loans would destroy the condition). Item ll, "Poor high school studenthood," has an M in the F column but an N in the R column. In this case, it was reasoned that Records was a more reliable source; few Financial Aids Officers have enough contact with the academic success of students to qualify as knowledgeable authorities. Hence, the investigator stood on the Records. For one more example of reasoning, Item 9, "Part-time studenthood, is chosen. The R source showed "M," the F source showed an "N" which was not neutral, but negative. That is, the Financial Aids Officers in convincing majority were saying, in common language, that part-timers are very likely to wind up as nondelinquents.
The R source said the difference between the two subpopulations was relatively small but the level of confidence is considerable. In this case, the investigator did bestow "Knowledgeable authorities" status upon the F respondents and chose "T" for his judgment. To avoid tedium, further reproductions of the investigator's reasoning are elided.
Table 11: Factors Assessed for Predictive Potency and Results of Assessments
Predictive Potency of the Variables
Operationally, "predictive potency" refers to the entries in sub column G of Table 11.
The investigator thinks the population of 24 factors, conditions, and experiences appearing under the "Not Predictive" section of Table 11 constitutes a major contribution by his investigation. In the text of Chapter III, many of these were nominated for future oblivion in the search for remediable causations of repayment delinquency. Although other studies have failed to find some of these 24 as having co-association relationships with delinquency, some studies were faulted by too-small populations, inadequate time-span frames, questionable percentages of response, too-limited or nongermane sources, and so on, which probably justified reruns. But, in the light of the investigative design and execution incorporated in the study being reported upon by this dissertation, it does appear fruitless to continue search in unrewarding territories
Intuitive assumptions and deductions about why former students do not repay loans promptly have plagued policy formers and administrators. Suspect factors galore have been advanced as "reasons," and have been attended to.
The variables chosen by the investigator for testing deliberately included many of these. The findings that 24 of the 33 variables, tested by dependable evidence, do not "predict" delinquency should lay to rest a considerable proportion of the confusion-from-suspicions which has characterized attacks upon the issue of delinquence in loan repayments.
For example, in Chapter I it was pointed out that many of the suspect factors can be categorized under the heading, "Lack of institutional diligence." In the final list of 33 discrete variables, Items 3, 10, 12, 14, 23, c6, 28, and 29 incorporated such suspicions. Seven of these eight items were not predictive. The sole exception was the possible negligence of Financial Aids Officers in not securing present-whereabouts information on drop-outs before they left college. On the more substantive "lack of diligence"–allowing students to borrow too much, catering too much to youthful overenthusiasm about borrowing, letting students become habitual (every-year) borrowers, failing to make aids other than loans known to students–institutional officers were not, for certain, abetting future delinquency in repayments.
At the other end of the spectrum are suspicions that what students encountered after they left college ("in the real world") distinguishes delinquents from nondelinquents. Items 15, 18, 20, 25, and 27 incorporated such suspicions. Every one of these is nonpredictive. Relatively few suspicions were found which focused on the personhoods of borrowers. Items 2, 7, 20, 21, and 22 incorporated such suspicions. Three of the five were not predictive. However, "predictive" here is measuring only F opinions, and on this basis it would be unwise, in the judgment of the investigator, to consign these to oblivion.The investigator's claim for having made a major contribution by clinching the predictive impotency of at least 21 items, however, rests upon conviction that irrationality in "trying to do something about borrower delinquency" can now be succeeded by increased rationality.
Attention is now turned to the 9 items which were, in some degree, predictive. Only three are strongly predictive, and they differ sharply in dimensions of impact. Item l1, "Drop-out before degree, has a considerable calendar-span of impact. Abandoning the pursuit of a college degree can occur before the first year of college is over, or after several years of possibly intermittent pursuit. It is a symptom highly correlated with delinquency. However, it is quite likely that it is only a symptom and that the reduction of the symptom by artificial means would not prevent repayment delinquency. The causations for drop-outness need to be identified more clearly than they are before this finding can be made practically useful.
Item 2."Bad record with respect to debts while in college," has no empirical evidence other than F opinions (presumably based upon observation). The incidence of bad-debts-records among a borrower population is not known, but it would be surprising to find that it is large enough to warrant regulatory efforts to eliminate it—even if such efforts cured the cause as well as the symptom, which is doubtful. In sum, the impact-span of this symptom is probably so limited that the "Strongly Predictive" finding is of questionable pragmatic value to political system processors.
Item 3."Dropped out without notice to Financial Aids Office," is of considerable span in impact because the lack of whereabout information delays, and sometimes renders highly impossible, collection contacts. However, lack of incidence-of-occurrence data prevents judgment of the practical utility in the finding of "Strongly Predictive." For example, the worrisomeness of a very few cases of this nature could have caused the "Strongly Predictive" opinions of Financial Aids Officers. On the other hand, an officer of the Coordinating Board, Texas College and University System, told the author that "thousands of borrowers each year show up as current-address-unknown cases on institution reports.
The five "Considerably Predictive" items ("Low college aptitude," "Family in lowest socioeconomic class", "In-college ire toward the Financial Aids Office," "“In-college low self concept," "Manifested low level aspiration"), with one exception, have wide-span impact. The exception is manifestation of a negative attitude toward the Financial Aid Office. It is difficult to perceive how this alone could have long-term significance, especially since the B source produced such warm acclaim for the contacts with financial aid counselors. Once more, lack of incidence-of-occurrence data causes this finding to be of questionable pragmatic value. The other four, on the other hand, have wide-span impact. This fact is made even more intriguing because of the well-known evidence the quartet often composes a syndrome; low socioeconomic status of the family is accompanied to significant degree by low self concept, low level of aspiration, and low academic aptitude when measured by paper-and-pencil tests. One Section Two derivation will be based in this intriguing finding. However, the only empirical evidence backing the "Considerably Predictive’ standing is the "T" derived from the R source for low college aptitude from a questionable sample; all other evidence consists of opinions from Financial Aids Officers.
The one "Mildly Predictive" item, "Part-time studenthood," is–at best–a subject for further investigation with respect to predictive potency. Such investigation is recommended, for two reasons. Its impact-span is considerable; a high proportion of the borrowers engaged in part-time study. And, part-timeness is a condition subject to pragmatic control.
Source Corroborations and Conflicts
Two items secured data from all three sources. Corroboration was perfect for each.
Eleven items secured data from two sources each. Corroboration existed for only five of these. For four of the six non corroboration items, conflicts existed. That is, one source yielded a "Not Predictive" result and the other a "Considerably Predictive’ result.
These figures seem to indicate that use of multiple sources to furnish data on the same item was wise. Certainly, the corroboration on Items l and 10 added high credence to the results. Also, some seemingly firm "truths" according to one source became less firm, or even questionable, when another source was consulted. This was particularly true when the two sources were both of subjective variety–opinions of Financial Aids Officers and perceptions by borrowers. The subjective predictions by Financial Aids Officers might have misled the investigator had it not been for the perceptions of borrowers.
For example, several predictions by the F source were to the effect that when borrowers received inadequate pre-loan counseling, odds were quite high that those borrowers would end up in delinquent status. This prediction might be correct. But, in the absence of B source data, the investigator probably would have assumed that a practically Significant discovery had been made. But the B source data revealed that only a relative handful of borrowers reported inadequate pre loan counseling, and those who so testified were about as likely to be in non delinquent status as delinquent status. For an opposite example, the F source data predicted that borrower acquisition of additional dependents was "Not Predictive" toward delinquency. One might suspect this opinion because it was obviously one not based on extensive observation. Data from the B source revealed empirically that the F prediction stood up. The most dramatic example, of course, was the F prediction that students who took for granted that the loan would not really have to be repaid are strongly headed for delinquency. The B source data did not prove this prediction to be false, but did reveal convincingly that almost no borrowers perceived that they ever embraced Such an assumption.
Section Two: Derivations from Findings
One purpose stated for the investigation is that of introducing useful information into the feedback loop of the Easton Model of a political System (see pp. 12-15). A second stated purpose is to do the same for institution-al administrators of college student loan programs. Section One contains information which, as is, serves both purposes. For reemphasis, the most important information therein consists of the items (factors, conditions, experiences) which (a) are not predictive of which borrowers are likely to be delinquent and/or (b) do not compose a Viable staging-ground for remedial action toward repayment delinquency.
Also springing from the investigative finding is other information which may be more "useful" to the political system and to institutional administrators than is the inventory appearing as Section One. The investigator asked the following question of his findings, “What is there here which should prove valuable to the interested in reducing the incidence of default among. HHCSLP borrowers?" Recalling that HHCSLP is a fairly good proxy for most student loan programs, answers should have generic import. The answers procured are data-based derivations, subjectively arrived at as hunches rather than as proclamations. They are now stated. The order of statements is not intended to be related to relative importance.
1. Soundness of Policy and Policies
Aggravation, and even frustration, by rates of delinquency and the dollar volume of past-due repayments should not obscure the fact that HHCSLP is sound public policy. It is doing lots of good for lots of young people, fostering equality of opportunity to secure the benefits a college education brings, and adding appreciably to whatever economic dividends the state and nation derive from a work force and public citizenry possessing college educations. The vast majority of borrowers aid earn a college degree; disillusionment with job and career was of tiny proportions; testimony that "I couldn't have got along without the loan" was in overwhelming proportions. To be noted carefully are the sheer numbers of freshmen who came into college by loan assistance; one is bound to suspect that HHCSLP was opening doors of opportunity otherwise closed to deserving high school graduates. And, these young people in preponderant degree made good on the opportunity and on their promise to repay the loan.
To look at some specifics of HHCSLP policy is also useful. Judged against repayment criteria, the limits are not too high. Permitting freshmen and sophomores to borrow is sound policy; in preponderance, they find other ways to support their pursuit of junior and senior years. Letting all types of institutions award HHCSLP loans does not induce delinquency. Delegating to institutions the award of loans to borrowers is effective and efficient; lack of due diligence on the part of some institutions in executing their responsibilities may exist, but the findings from this study indicate that lack of diligence must be the exception, rather than the rule. Perhaps some changes in legislative, Coordinating Board, and institutional loan-making policies could make a slight improvement in subsequent rates of borrower delinquency: However, findings by the present investigation indicate: (a) the improvement will not take effect immediately; (b) careful prediction of the consequences for all potential borrowers should be weighed in making a policy change; and (c) the costs/benefits ratio for a projected change should be weighed realistically.
Policies respecting loan collection are addressed by Derivation.
2. Information Collected on Borrowers
The focus here is not upon the full range of borrower information required for reporting, accounting, and management decisions. The investigator was favorably impressed by the coverage of the information on borrowers stored by the Coordinating Board. His impression of institutional storage is distant and piecemeal, and a judgment of its adequacy is not made.
The present focus, instead, is upon information about borrowers which would advance studied search for causative conditions linked to delinquency in repayments. Two hunting grounds for such search were identified by the present investigation. One of these is what happens to, or characterizes the behavior of, borrowers while in college after the first loan is made. A second is post-college conditions and behavioral developments impinging upon borrowers. And, although the investigator has Opinioned that the preloan hunting ground is unpromising, it could come to pass that information on variables omitted from the present study would be worth collecting and storing.
The investigator foresees that the future "search" studies needed will be similar to this one in two respects. They will be intensive investigations of "leads," hence tailor-made for the occasion. Second, they will need to draw heavily upon stored data. The present state of information holding is not perfect, perhaps, but the holdings are sufficient to be of decided aid to a researcher. It is not recommended that a lot of money and effort be expended to close gaps by a "crash" endeavor. A little, targeted addition each year is indicated. The big problem to be licked is that of inadequate computer storage and, especially, retrieval. Lack of funds budgeted for these purposes is the major blockage.
It is easy for a special-interest investigator to "spend" the money of the Coordinating Board and institutions to serve his or her ends. This investigator will not do so. He simply reports that, in his opinion, future "search" studies are likely to be impeded by the existing capacities for computer-storage of borrower information, and dysfunctionally so by percent capacities for generating retrieval hardware and software.
3. The Personhood Variable
The total evidence secured on the behaviors of borrowers tends to indicate that neither external circumstances surrounding a borrower nor symptomatic observable actions of a borrower are ever going to predict significantly which borrowers are going to decide to default on loan repayment. Certainly, removing a symptom such as "Failure to pay debts while in college" might, in itself, avoid a few defaults, but the odds are not high in that direction. The investigator derives a hypothesis–internal to the borrower–which overrides nearly all symptoms and most external circumstances in "“causing' a decision at a particular time under particular circumstances to default. This highly involved matrix of value hierarchies, automatic behaviors, self-orientations, other-orientations, and so on is referred to as personhood. The challenge of this hypothesis to prevention of decisions to default is to either (a) change personhoods permanently, in time, or (b) adapt to person hoods in choice of external rewards or punishments.
This derivation, in effect, holds that symptoms are merely indicators that the borrower may be in trouble in getting his or her personhood straightened out to fit what HHCSLP assumes is the proper priority to place upon paying back a loan. Actually, some "symptoms" may not do even that; "Ire at the Financial Aids Office” may be so particularistic that it does not characterize the deep-seated personhood tendencies. Having remedial effect upon such tendencies, this derivation implies, is about the only hope that default at borrower initiative can be prevented. For prevention tactics focused upon the borrowers, policy makers and administrators have only three avenues open: (1) Strongly Predictive indicators can be used to screen out borrowers at time of application; (2) indoctrination counseling, and perhaps other devices, can be used to reduce behavior symptoms which are Strongly or Considerably Predictive, while borrowers are in college; (3) loan-collection procedures can be devised to overcome personhood tendencies to default.
Avenue l. Predictive indicators available at first-loan time were found by this study. Three Considerably or Mildly Predictive ones were located: Family in lowest socioeconomic class; Low college aptitude scores; Part-time student hood. One obvious tactical option is to enunciate rules for institutional loan makers to follow. For example, if an applicant shows two of these three symptoms, decline the loan. This would almost guarantee, however, that large numbers of the victims of the rule would be the very students toward whom HHCSLP is beamed–those who deserve and need loans and who will repay. That price is too high to pay, the investigator thinks. Another option is to say to lending officials, "There are warning symptoms, but use your own judgment in declaring that some who manifest them are ineligible and others are good risks." The chances that this tactic is even workable are very low, in the investigator's opinion. How can a Financial Aids Officer justify denial to some and approval for others having the same symptoms? The only security available is to be uniform–yes to all or no to all–and the result is likely to be blind institutional decision-making rules as dangerous as Option One. The analysis just presented seems to close the use of Avenue l–screen-out at first loan stage.
Avenue 2. The second avenue opens after the borrower is on campus with a loan. The rationale is: (a) A given institution now has students who are borrowers manifesting symptoms associated with personhood disorders (disorders in the sense of not being straightened out toward HHCSLP repayment expectations). (b) In addition to the three symptoms enumerated in the preceding paragraph, the most Strongly Predictive one found in the present study could be in the making: Dropping out from the pursuit of a college degree. (c) Many indicators can forewarn of dropping out–low success in classwork, high rates of nonattendance, difficulties in making financial ends meet, manifested disinterest, casualness toward obligations, and several others found significant in studies of why students drop out of college. (da) The borrowers manifesting these symptoms or indicators can be identified through the college's Student Records System, with a few supplementary additions, composing a target population for personhood interventions. (da) Devices (ways and means) for such intervention can be mounted by the college to "treat" the suspect population.
Readers are referred to the West Texas State University story (see chapter II, Section II: History of the Hinson-Hazlewood College Students ) as a demonstration that Avenue 2 is not pure imagination. Borrowers were identified. Intervention devices were thought up and applied. The author of the story thought they did change personhoods, although no tangible evidence was adduced. One can think offhand of several other intervention tactics–group counseling, one-to-one counseling, "club-type' at fairs, applied psychology groups, and so on, already common on institutional campuses. It is not at all necessary, of course, that borrowers be segregated or categorized for intervention; much of that which is contemplated could be for all students who are appealed to by such opportunities.
Nevertheless, the detailing of the tactics necessary to exploit Avenue 2 was a deliberate move by the investigator to show its extremely questionable practicality. At every turn one encounters high cost, unproven effectiveness of the ways and means for intervention, inevitably low yield from mammoth efforts, and forecasts of negative consequences as well as positive ones. The net conclusion on the part of the investigator is that the state of the art for intervention in personhood is not ready to make use of Avenue 2 practicable as a hope for reduction in rates of borrower defaults.
Avenue 3 is the subject of the next derivation.
4. Collection Interventions
The inquiry instrument to the B source in the present study carefully avoided items which smacked of "why are you delinquent in your repayments?’ for obvious reasons. Hence, the evidence secured sheds little light on how to go about getting delinquents to pay up. On the other hand, the B source evidence is rather clear in indicating that it was not what happened "back there" which suborned delinquency in repayments. This, coupled with the analyses of the prospects for in-college prevention previously presented, leads to the following derivation: The most promising prospect at present for reducing the incidence of delinquency in repayments is collection action just before and immediately after the first repayment date.
The investigator is aware that other "cures" have been advocated, such as requiring a cosigner with collateral pledged before a loan is made, or making the applicant sign a wages-lien to secure 4 loan, or starting a borrower reserve fund for each lendee through loan deduction(s) made and deposited to repayment credit accounts. He has no evidence on the efficacy of such actions, but does point out that they rest upon speculations that circumstances surrounding a borrower at time of repayment are causing default. Almost no firm evidence exists on what those circumstances are.
The derivation stated above rests upon a hypothesis (see Derivation 3) that personhood orientations are a major, although not the sole, explainer of repayment behavior. There comes a time when those orientations can no longer be tolerated if any antidote is available.
Vigorous, and even punitive, overrides to the strengths of malorientations may well be the only effective override in a majority of cases. But, persuasion or compromises or just plain persistence can be incorporated in loan collection procedures also. It is not within the province of this investigation and report to get into the perplexities and countercurrents of HHCSLP loan collection. The derivation is saying simply that the results of the present investigation point toward loan collection as a prime remedy for defaults (but not of the personhood malorientations underlying defaults).
5. Institution Malfunctions
When the R source data were processed to discover the predictive potency of type of institution, no degree of potency was found. But, the institution-by-institution data revealed certain institutions had a much higher proportion of delinquents in their borrowers than did most of the others. This was not reported because it is not evidence; the sample was not constructed in proper manner.
However, during the period of completing the present report, the U.S. Department of Health, Education, and Welfare issued nationwide statistics revealing that some institutions had rates of delinquency among their lendees four and five times the national norm. Treating this information as if it revealed cause-effect relationships, the Department placed ceiling quotas upon these institutions if the federal government's Guaranteed Loan Program was to be used by states having programs similar to HHCSLP. The investigator is neither approving nor disapproving this "cure," but cites the statistics as some evidence that there may be malfunctioning in enough institutions to make it worthwhile to undertake remedial action.
Ordinary "lack of diligence" on the parts of lending institutions did not emerge as a significant phenomenon in the study reported upon by this dissertation.
The evidence did indicate, but did not prove; much higher proportions of borrowers from lowest socioeconomic levels in some institutions than in the median institution. Many institutions have accepted it as their mission to actively recruit and serve "high-risk" students–those from low socioeconomic levels and/or ethnic minority populations–and the present study produced some evidence that such students may also be higher-risk borrowers than the norm.
In the opinion of the investigator, however, it would be mistaken social policy to use this set of conditions to punish institutions and borrowers wholesale because disadvantaged students are, at present, defaulting in 25 to 50 percent of the cases. There is one semi clue, however, in the present study's evidence which may point to a malfunction in HHCSLP local administration. This is the high proportion of freshman borrowers in the lendee populations at some institutions. Further investigation might reveal that some institutions are over conscious of their need for more enrollees to "earn" more income, and engage in oversells to students who are undecided, ambivalent about being college students, obviously not college timber, and so on. Gossip to this effect goes around, but this investigator had repeatedly shown that policy for HHCSLP cannot trust gossip. The facts can be ascertained by investigation, though, and this particular suspicion seems to warrant the necessary expenses for such investigation–especially so because this type of investigation typically itself "cures" the malfunction if it exists.
6. The Payoff from Research
Of course, the payoffs from research–if any–are dependent upon the quality, and hence the definitiveness, of the research itself. Achievement of quality requires targeted conceptualization and painstaking design, among other things, not the least important of which are considerable sums of money. Provided the foregoing essentials, can research produce payoffs for policymakers and policy implementers?
As an answer to that question, a final derivation is submitted with humility. The findings and derivations presented herein can have payoff. There is no reason to think that this particular foray is an exception to a general rule for reasonable-quality, practically targeted research.
However, the "can" in the preceding derivation is not "will." The gap between research, and implementation of its findings and hunches, is notoriously baffling. What happens to feedback in the Easton Model takes place in the black box, which, in turn, is processing inputs from prodigious and complex political, economic, and ideational entities in its guidance system. At best, an optimist might change "can" to "may."
Section Three: Promising Foci for Further Research
"Promising' in the title of this section has reference to the payoff defined under Derivation 6. The foci for research endeavors have been indicated already in the texts of Sections One and Two. Their listings in the present section are therefore by didactic format rather than by discussive justifications.
- For practical utility in identifying, individually, high-risk-of-default applicants at time of first loan: a search for syndromes of descriptors which are historically characteristic of a large proportion of delinquents and a small proportion of nondelinquents. (None may be found; but policymakers need to know this as the final clinches to stop trying at preloan Level. If any are found, they will be more useful for Avenue 2 than for Avenue 1.)
- For utility to Avenue <@ explorers, a search of the prolix literature on personhood dynamics to identify total-personhood types highly associated with the symptom of dropping out of college.
- For utility to Avenue 2 explorers, controlled experiments to ascertain the efficacy of a means, or several means (such as those indicated in Chapter IV, Section two: Information Collected on Borrowers) in attracting and holding borrowers as patrons. Brave souls might even try means-personhood results research.
- For utility to Avenue 2 actions by Financial Aids Officers and student counselors, a search seeking to locate the information bits on borrower in-college experience and observable behaviors which are indicative of symptoms (or syndromes) which should be channeled by the college's Student Information System to officers and student counselors.
- To deliver facts respecting institution-by-institution administrative and preventional diligence, audits of a stratified sample of institutions can be performed and results reported. The research contribution would include the construction and validation of a set of evaluative criteria, against which the appraisal audits would be conducted by employing interviews and objective data as documentations.
- To test the "circumstances as cause" hypothesis, careful mapping (by sample population investigation) of the post college circumstances and conditions encountered by borrowers between leaving college and the date of the study. The methodology for measuring predictive potency in the present study would be desirable for comparative purposes. However, the investigator doubts that questionnaire instrumentation for procuring data will succeed in getting at the real circumstances. Structured interviews, though costly, would do better, in his opinion. As an added suggestion: the present investigation did not subdivide delinquency into types–for example, never paid, delayed payments, but made some; number of payments in arrears; number of contacts received from loan-collectors, and so on. Some subcategorization for delinquency might shed additional light.
- To test a hypothesis that non repayment is a rational–or a rationalized–cause-effect decision, go to delinquents alike and ask them for "causes of their decisions. Although a single investigator could encompass only small samples, cumulative repeats, or team inquiry, could be quite rewarding with information not now possessed. Granting that this style of investigation calls for higher research sophistication than the present investigator would lay claim to, policymakers are now making decisions based upon complete absence of even non-sophisticated information on what borrowers say.
- To serve policymakers in selecting and implementing loan-collection tactics, pilot tests of contrived tactics can be run with ample populations of delinquents. Evaluation of results and consequences should be the prime research focus.
In the light of the findings and of the derivations set forth, the investigator accords highest payoff promise to 6, 7, and 8 With this, the dissertation report closes.
Appendix
Questionnaire I
Salvador H. Gomez
Director, Financial Aid
University of Texas at
San Antonio
San Antonio, Texas 78285
Dear Colleague:
I am conducting a study of factors which may affect repayment of Hinson~Hazlewood Student Loans. I need your judgments. As a Financial Aid Officer, your conclusions and hunches drawn from experience and observation will be of help in redefining state policy. Incidentally, you will also help me with a doctoral dissertation: |
The opinionaire attached enables you to transmit your judgments, without identifying yourself in any way. Please execute the instrument and return it in the envelope furnished. The sooner, the better. Thank you very much.
Sincerely,
Salvador H. Gómez
Opinionnaire
Hinson-Hazlewood College Student Loan Program
Listed below are factors which some allege are associated with Hinson-Hazlewood (TOP) borrower delinquency in repaying student loans. That is, certain factors will appear more frequently in a population of delinquents than in an equal population of non-delinquents. Assume that two equal and large populations are made up of Texas students whose repayments were scheduled to begin one year ago. In your opinion, would each factor be
more prevalent in the delinquent population than in the non-delinquent one?
Please indicate your answer by circling the lettered descriptor that best expresses your opinion about each factor. Following are code letters and descriptors to be used for this
purpose.
COORDINATING BOARD
TEXAS COLLEGE AND UNIVERSITY SYSTEM
HINSON-HAZLEWOOD COLLEGE STUDENT LOAN PROGRAM
P.O. Box 12788 Capitol Station
Austin, Texas 78711
Area Code 512 475-4147
Questionnaire II
TO : Hinson-Hazlewood College Student Loan Program Borrowers
(Formerly known as Texas Opportunity Plan)
FROM : Mack C. Adams, Head of Division of Student services Mite Marna)
SUBJECT: Survey of Borrowers
A survey of recipients of Hinson-Hazlewood Loans is being sponsored by
the Coordinating Board, Texas College and University System.
Our concern is to make the Hinson-Hazlewood College Student Loan Program
increasingly effective. Information and views from loan recipients are
essential to the undertaking. Therefore, we solicit your assistance in completing and returning the enclosed questionnaire at your earliest convenience. A self-addressed envelope is provided, and postage will be paid by our office.
Hinson-Hazlewood College Student Loan Program ( HHCSLP )
(formerly known as Texas Opportunity Plan)
Questionnaire II
The following seven statements may Or may not match your own experience in exploring and/or eventually assuming a HHCSL loan. Mark each statement with an M if the statement matches your own experience, with a P if it partially matches your experience, and with a D if it does not match your experience at all. These are your experiences at the institution where you incurred your last loan.
COORDINATING BOARD
TEXAS COLLEGE AND UNIVERSITY SYSTEM
HINGON-HAZLEWOOD COLLEGE STUDENT LOAN PROGRAM
P.O. Box 12788 Capitol Station
Austin, Texas 78711
Area Code 512 475-4147
Questionnaire III
TO: Hinson- Hazlewood College Student Loan Program Officers
FROM : Mack C. Adams, Head of Division of Student services nee (Lina
SUBJECT: Survey of Borrowers
This survey, being sponsored by the Coordinating Board, is an attempt to assess the relationship between the personal characteristics of delinquent and nondelinquent Hinson-Hazlewood College Student Loan Program borrowers.
On the attached form you will find the name(s) and social security number(s) of the student borrower(s) who attended your institution who is(are) being studied. To the right are characteristics being assessed in this study.
Please complete the form as accurately as possible from whatever records
are at your disposal. The questionnaire should be completed and returned
to us no later than ten working days from the date of this letter. On the reverse side of this letter is an Instruction Sheet describing each of the characteristics being surveyed. All information concerning the subjects will be kept in strict confidence and no reference to names of students will be made in the analysis of the data.
Thank you for your assistance and cooperation in making this survey possible. As usual, your prompt attention to this request will be appreciated.
Questionnaire III: Instruction Sheet
Item:
1. Under the social security number of each student, enter the city
of permanent residency at the time the first loan was incurred.
2. Was student enrolled as a full-time or part-time student when first loan was extended? (Enter FT or PT)
3. The age of the borrowers at the time they received their first loan at your institution.
4, The classification of the borrowers (i.e. freshman, sophomore,
etc.) at the time of their first loan at your school.
5. Estimated gross annual family income at the time they received
their first loan at your school.
6. Marital status (single, married, divorced).
7. Did borrowers receive a degree from your institution, i.e. A.A.,
B.A., B.S., etc. Answer yes or no.
8. The sex of the borrowers.
9. The borrowers rank (quartile) in their high school graduating class.
10. The total amount borrowed by each student at your school.
11. Composite score(s) on college entrance examinations (i.e. S.A.T. or ACT).
12. Were students given other financial aid at your school for the same
semester(s) they were awarded a TOP Loan(s)? (Answer yes or no)
13. Number of academic years student received loans at your institution.
14. Please mark which of the six categories best describes your institution.
Vita
Salvador Humberto Gomez was born in Eagle Pass, Texas, on July 31, 1931, the son of Domenja Fuentes and Salvador Gomez. After completing his work at Eagle Pass High School, in May, 1950, he attended Coyne Electrical Technical School in Chicago, Illinois. The following summer he enlisted in the United States Air Force and was Honorably Discharged in August, 1955. He entered Trinity University in September, 1955, and finished his Bachelor of Science degree in Business Administration in June, 1958.
During the following six years he was employed as an accountant and later as manager of a major tire store in San Antonio, Texas; in 1964 he left business and turned to education, teaching sixth grade in the San Antonio Independent School District. While teaching, he also operated an auditing business of his own. In 1967 he left the school system after accepting employment as a Corporate Trainer with the City Public Service Board. While employed in this capacity he received his Master's degree in School Administration from Our Lady of the Lake University in June, 1970. In the summer of 1971 he returned to education joining San Antonio Junior College as the Director of Financial Aids. In June of 1972 he became the first and current Director of Student Financial Aid at The University of Texas at San Antonio. He is married to the former Amelia Alcala from Alice, Texas. They have five children: Rosanna, Salvador Jr., Jaime, Orlando and Ricardo.
Permanent address: 5610 Danny Kaye
San Antonio, Texas 78240